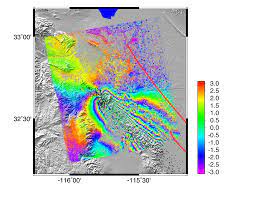
I have latitude, longitude and mean velocities like below,
72.3 22.4 2
73.2 22.5 -1
72.4 22.4 0
How can I plot different color indications for different velocities.
I have latitude, longitude and mean velocities like below,
72.3 22.4 2
73.2 22.5 -1
72.4 22.4 0
How can I plot different color indications for different velocities.
Sorry longitude , latitude and mean velocities
You need to make a CPT via makecpt that relates your range of velocities to color, then use that CPT when you plot your symbols in plot via -C. Let say your velocities range from -5 to +5. Then do gmt makecpt -T-5/5 and then use -C in plot.
I created one cpt file using your command,
gmt makecpt -T-10/10 > test.cpt
Now how can I plot the mean velocities with respect to the particular lat long?
It depends on what type of plot do you want to make.
Dear pwessel,
I want to below kind of plot using Long, lat, and mean velocities as shown in the above post. please help me.

If you have a table of data, you have to create a grid first and them plot the grid.
I recommend you first work your way through the tutorial so you know what kind of decisions you will need to be making.