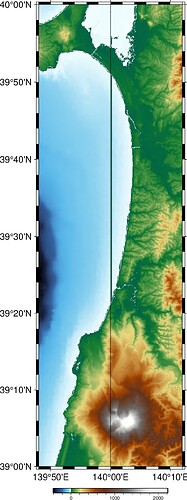
import pygmt
fig = pygmt.Figure()
with pygmt.config(
FORMAT_GEO_MAP = ‘ddd.x’,
):
fig.basemap(
region=[139, 141, 39, 41],
projection =‘M12’,
frame=[“WSne”, “xa1f+lLon”, “ya1f+lLat”],
)
grid = pygmt.datasets.load_earth_relief(resolution=“03s”, region=[139, 141, 39, 41])
fig.grdimage(grid=grid, projection=“M12”, cmap=“geo”)
fig.colorbar(frame=[“a1000”, “x+lElevation”, “y+lm”])
fig.show()
Using pygmt.datasets.load_earth_relief(resolution=“03s”) in PyGMT, a line appears at 130° or 140°E.
Is there any way to prevent this from showing up?
