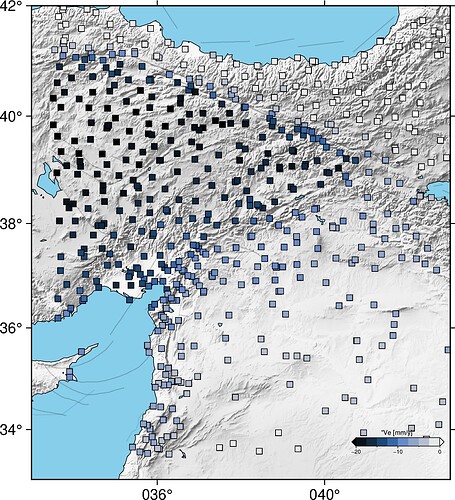
Hello,
I’m plotting a Mercator map in PyGMT with this command:
region_TR = [35, 45, 34, 42] # Turkey
fig.basemap(
projection=“M10c”,
region=region_TR,
frame=[“x4f8+e”,“y2f4+e”,“WSne”]
)
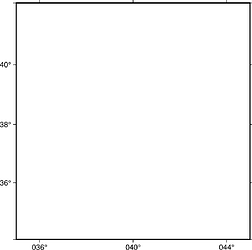
But instead of longitude ticks at 36°, 40°, 44° (as I expect from the region), the x-axis annotation sometimes starts at 0°.
My question; is there a recommended way in PyGMT to ensure the x axis ticks always match the region bounds (e.g., 36°, 38°, 40°, 42°)?
Thanks in advance!
The version and dependencies are below:
PyGMT: v0.13.0
PyGMT information:
version: v0.13.0
System information:
python: 3.10.18 | packaged by conda-forge | (main, Jun 4 2025, 14:45:41) [GCC 13.3.0]
executable: /users/eemne/.conda/envs/licsbas/bin/python
machine: Linux-5.14.0-427.33.1.el9_4.x86_64-x86_64-with-glibc2.34
Dependency information:
numpy: 1.26.4
pandas: 2.2.3
xarray: 2024.3.0
netCDF4: 1.7.2
packaging: 25.0
contextily: None
geopandas: 1.1.1
IPython: 8.37.0
rioxarray: 0.18.1
gdal: 3.10.3
ghostscript: 10.04.0
GMT library information:
version: 6.5.0
padding: 2
share dir: /users/eemne/.conda/envs/licsbas/share/gmt
plugin dir: /users/eemne/.conda/envs/licsbas/lib/gmt/plugins
library path: /users/eemne/.conda/envs/licsbas/lib/libgmt.so
cores: 64
grid layout: rows
image layout:
binary version: 6.5.0
Also I can’t set up the font size of annotation, colorbar label, even I configure the config as below:
pygmt.config(
MAP_FRAME_TYPE=“plain”,
FONT_ANNOT_PRIMARY=“10p,Helvetica,black”, # ticks (axes + colorbar)
FONT_LABEL=“12p,Helvetica-Bold,black”, # labels (axes + colorbar +t/+l)
)
Hi @muhammetnergizci,
Regarding the font size of the colorbar
Up on GMT 6.5 for mode mode, an automatic scaling of the font size of the colorbar labels based on the width of the colorbar was introduced (please see #6802). In the dev docs there is a note (please see https://docs.generic-mapping-tools.org/dev/colorbar.html#description). There are several reports and comments on GitHub and the forum (e. g., GenericMappingTools/pygmt#3041 and Multiple colorbars changes the annotation fontsize) discussing how to handel this.
1 Like
Regarding the frame annotations
Maybe you (unintentionally) changed something regarding the default settings?
If setting FORMAT_GEO_MAP="DDD" (for details please see the GMT docs at gmt.conf — GMT 6.6.0 documentation) I get a leading “0” for the longitude axis.
import pygmt

region_TR = [35, 45, 34, 42]

fig = pygmt.Figure()
pygmt.config(MAP_FRAME_TYPE="plain", FORMAT_GEO_MAP="DDD")

fig.basemap(projection="M10c", region=region_TR, frame=["x4f8+e","y2f4+e", "WSne"])

fig.show()
1 Like
Dear Yvonne,
Many thanks for the links and answers! Both are working now. I’ve been using PyGMT for a long time on a different terminal, and when I loaded PyGMT in another conda environment I ran into these issues. They are now solved thanks to your help!
Cheers,
M N


