GMT Community Forum
Make cpt to plot Z values
Q&A
brioglade
October 25, 2021, 1:43am
1
(9$Y%9XPQ51R~4V
1002×766 24.7 KB
1@FBJHT@VMFOT1EVVZX4_NE
1003×909 76.9 KB
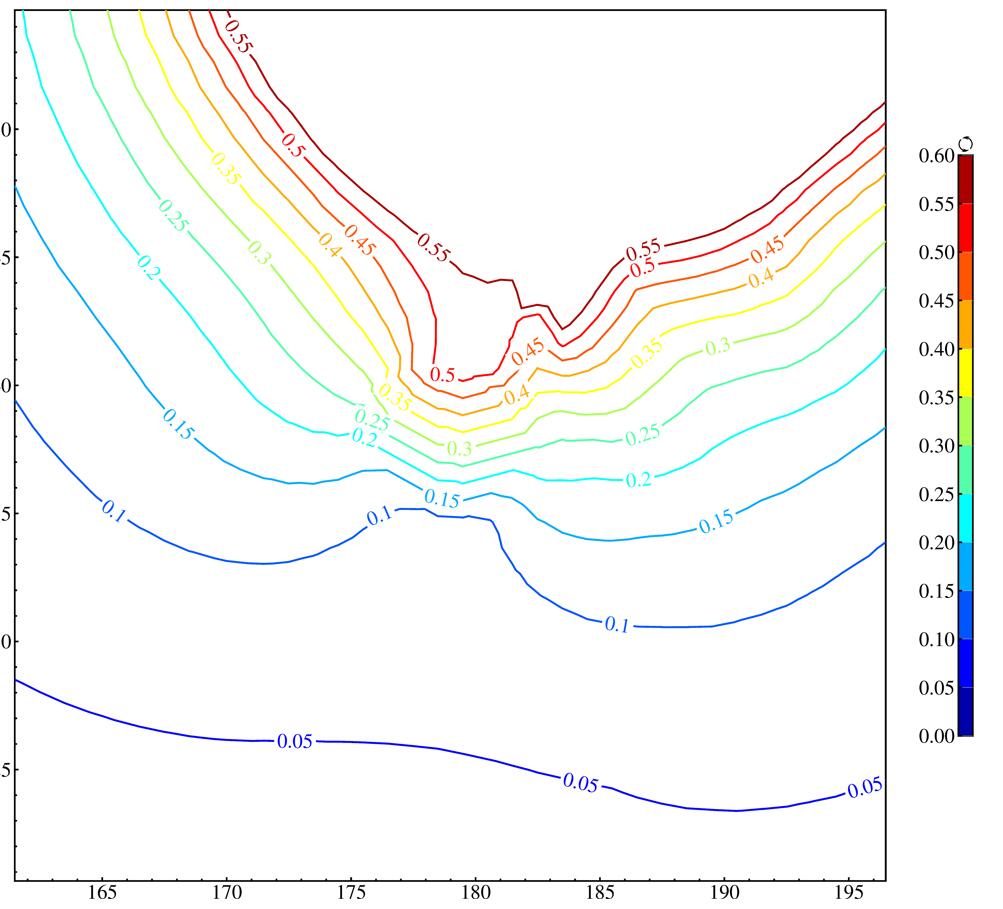
hi,The rest are less than 0.6. How can I subdivide the cpt below 0.6 and plot?
image
989×760 179 KB
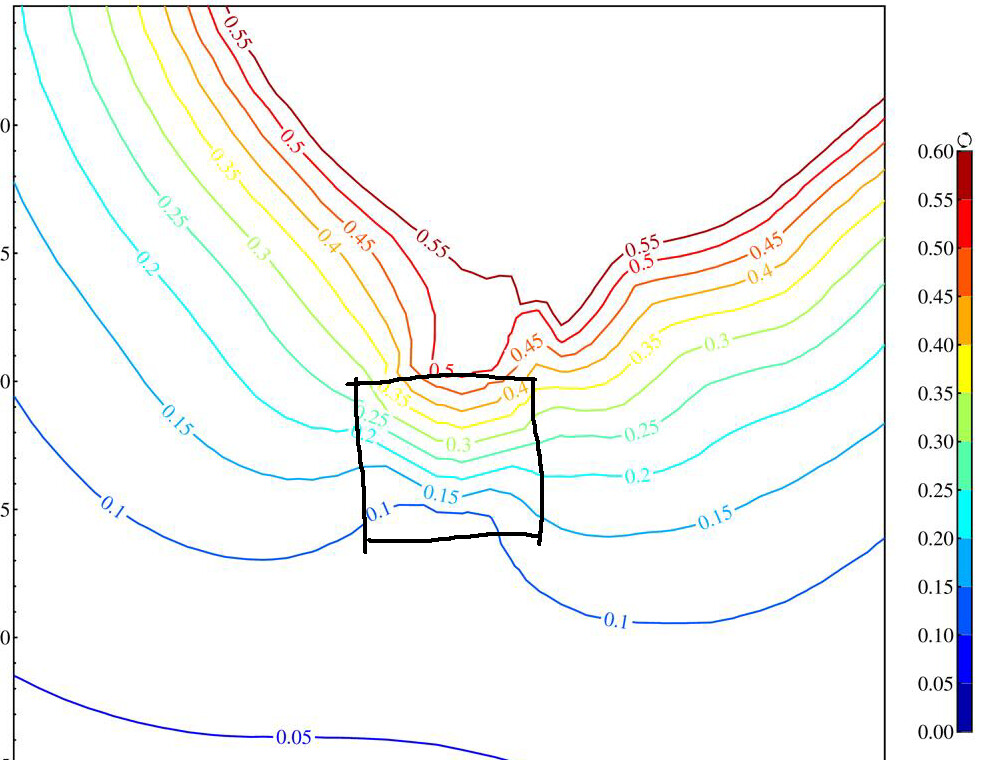
In fact, there is an area without data in the black wireframe. How to deal with these data in GMT and draw contour map is the most appropriate way?
Thank you very much.