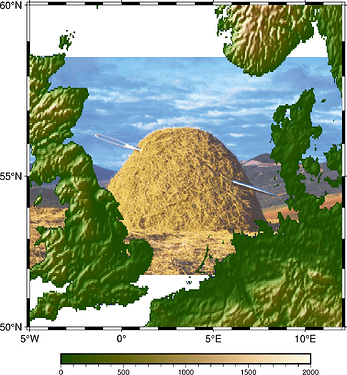
I’ve got a geotiff file that I’m plotting with pyGMT. I really need the ocean to be transparent AND I also need the 3d effect on land from shading. My goal is to create a shadow with PIL and overlay the map on that to get a 3D coastline effect (via the shadow). In order for that to work, the ocean should be transparent. using PIL to make a color translaprent results in some jagged edges and bleeding. While it’s possible that I can get it right manually, I really feel there should be a workaround in pyGMT.
I’ve been completely unable to get the ocean to be transparent in pyGMT. I’ve tried various solutions for over 8 hours today. At this point, I’d even setting for a land mask where the shadow is generated for a coastline only and I’d manually add it in photoshop. An automated solution would be ideal though! code below
Summary Requirements:
- Ocean = Transparent
- Land = 3d effect from shading/azimuth
Thanks!
# region_map is just a list of lats and longs for region.
# grid_map is an Xarray of a DEM geotiff file

lon_spacing = abs(float(grid_map.lon[1] - grid_map.lon[0]))
lat_spacing = abs(float(grid_map.lat[1] - grid_map.lat[0]))
spacing = f"{lon_spacing}/{lat_spacing}"
land_mask = pygmt.grdlandmask(
    region=region_map,
    spacing=spacing,
    maskvalues=[1, 0],   # land=1, ocean=0
)

fig = pygmt.Figure()
with pygmt.config(FONT=f"{FONT}"):
    fig.basemap(
        region=region_map,
        projection="M12c",
        frame=["af+s25p/25p/gray30", 'g']
    )

fig.grdimage(grid=grid_map, region=region_map, cmap='viridis', shading=intensity)

# Overlay land mask to clip the ocean
fig.grdimage(
    grid=land_mask,
    cmap="gray",         # color land (or choose something else)
    transparency=100     # ocean fully transparent
)

fig.show()
