Hi all;
I have 3 more figure to make before I submit my AGU poster by 23:59 tonight EST.
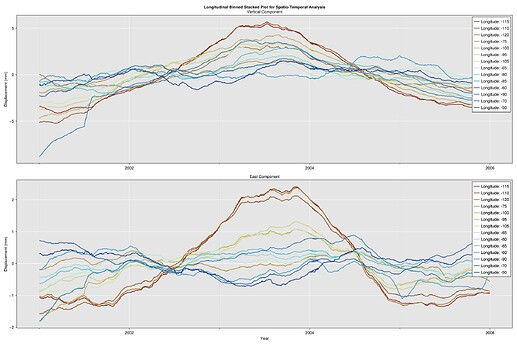
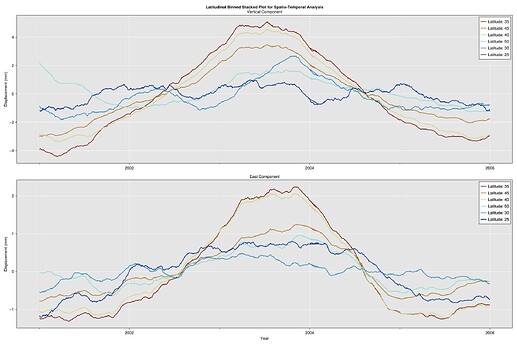
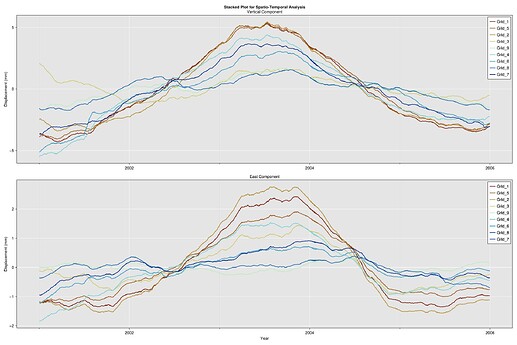
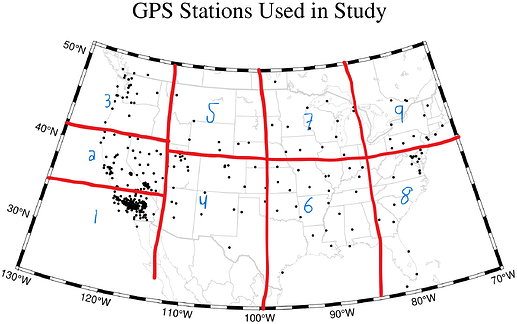
What I am trying to do is create a lines that will either fill with the corresponding color of the regions OR just have text telling which region is which for I created for grouped GPS stations. I suspect the latter may be simply to do given the time constraint I have.
Here is are the plots and the map I want to modify with the overlay.
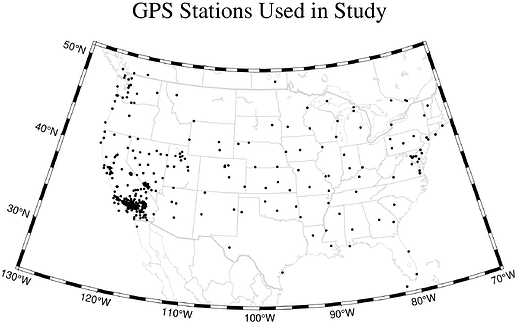
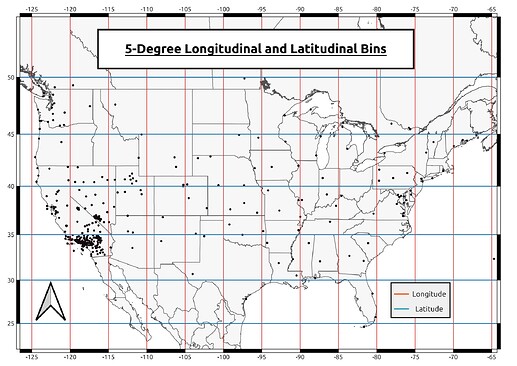
and here is the map:
The colormap used in the above 3 regional plots is called Roma – and I want to make 3 figures – one for each bin I have. Longitude, Latitude, and Grids; where each bin is colors the same as the corresponding region in the above plots.
Something like this, maybe:
I was trying to modify this function I wrote to create the grids; but I’m having trouble figuring out how to go about it:
# Function to assign regions on (lon,lat) grid
function assign_region(longitude::Float64, latitude::Float64)
    if -125 < longitude && longitude < -115 && 24 < latitude && latitude < 35
        return "Grid_1"
    elseif -125 < longitude && longitude < -115 && 35 <= latitude && latitude < 41
        return "Grid_2"
    elseif -125 < longitude && longitude < -115 && 41 <= latitude && latitude < 50
        return "Grid_3"
    elseif -115 <= longitude && longitude < -100 && 24 < latitude && latitude < 40
        return "Grid_4"
    elseif -115 <= longitude && longitude < -100 && 40 <= latitude && latitude < 50
        return "Grid_5"
    elseif -100 <= longitude && longitude < -85 && 24 <= latitude && latitude < 40
        return "Grid_6"
    elseif -100 <= longitude && longitude < -85 && 40 <= latitude && latitude < 50
        return "Grid_7"
    elseif -85 <= longitude && longitude < -50 && 24 <= latitude && latitude < 40
        return "Grid_8"
    elseif -85 <= longitude && longitude < -50 && 40 <= latitude && latitude < 50
        return "Grid_9"
    else
        return "You messed up somewhere..."
    end
end
And here is the function I wrote for the lon/lat bins.
# Function to assign regions in x-degree longitude increments
function assign_region(longitude::Float64)
    bin_start = floor(longitude / 5) * 5
    bin_end = bin_start + 5
    return "$(Int(bin_end))"
end
Here is what I have so far – it’s just the basemap for each component so far.
using GMT, DelimitedFiles, DataFrames, CSV, Glob

lonlat = gmtread("/home/rob/Documents/julia/gmt_jl/lonlat.txt");


GMT.basemap(region= [-130 -70 24 51], proj = (name = :lambertConic, center = [-100 35], parallels = [33 45]),
    coast = (borders = ((type = 1, pen = ("thick", "black")), (type = 2, pen = ("thinner", "lightgrey"))),
        area = 500,
        shore = (:thinnest, :lightgrey)),
    title = "Longitude Bins"
);

GMT.basemap(region = [-130 -70 24 51],
    proj = (name = :lambertConic, center = [-100 35], parallels = [33 45]),
    coast = (borders = ((type = 1, pen = ("thick", "black")), (type = 2, pen = ("thinner", "lightgrey"))),
        area = 500,
        shore = (:thinnest, :lightgrey)),
    title = "Latitude Bins"
);

GMT.basemap(region = [-130 -70 24 51],
    proj = (name = :lambertConic, center = [-100 35], parallels = [33 45]),
    coast = (borders = ((type = 1, pen = ("thick", "black")), (type = 2, pen = ("thinner", "lightgrey"))),
        area = 500,
        shore = (:thinnest, :lightgrey)),
    title = "Gridded Regions"
);
I’m currently on a flight into Baltimore and I’ll be trying to figure this out while I’m on the flight. Any insight or help is much appreciated!
- Rob
