Apologies if this has been covered elsewhere, but I searched and couldn’t find a similar thread.
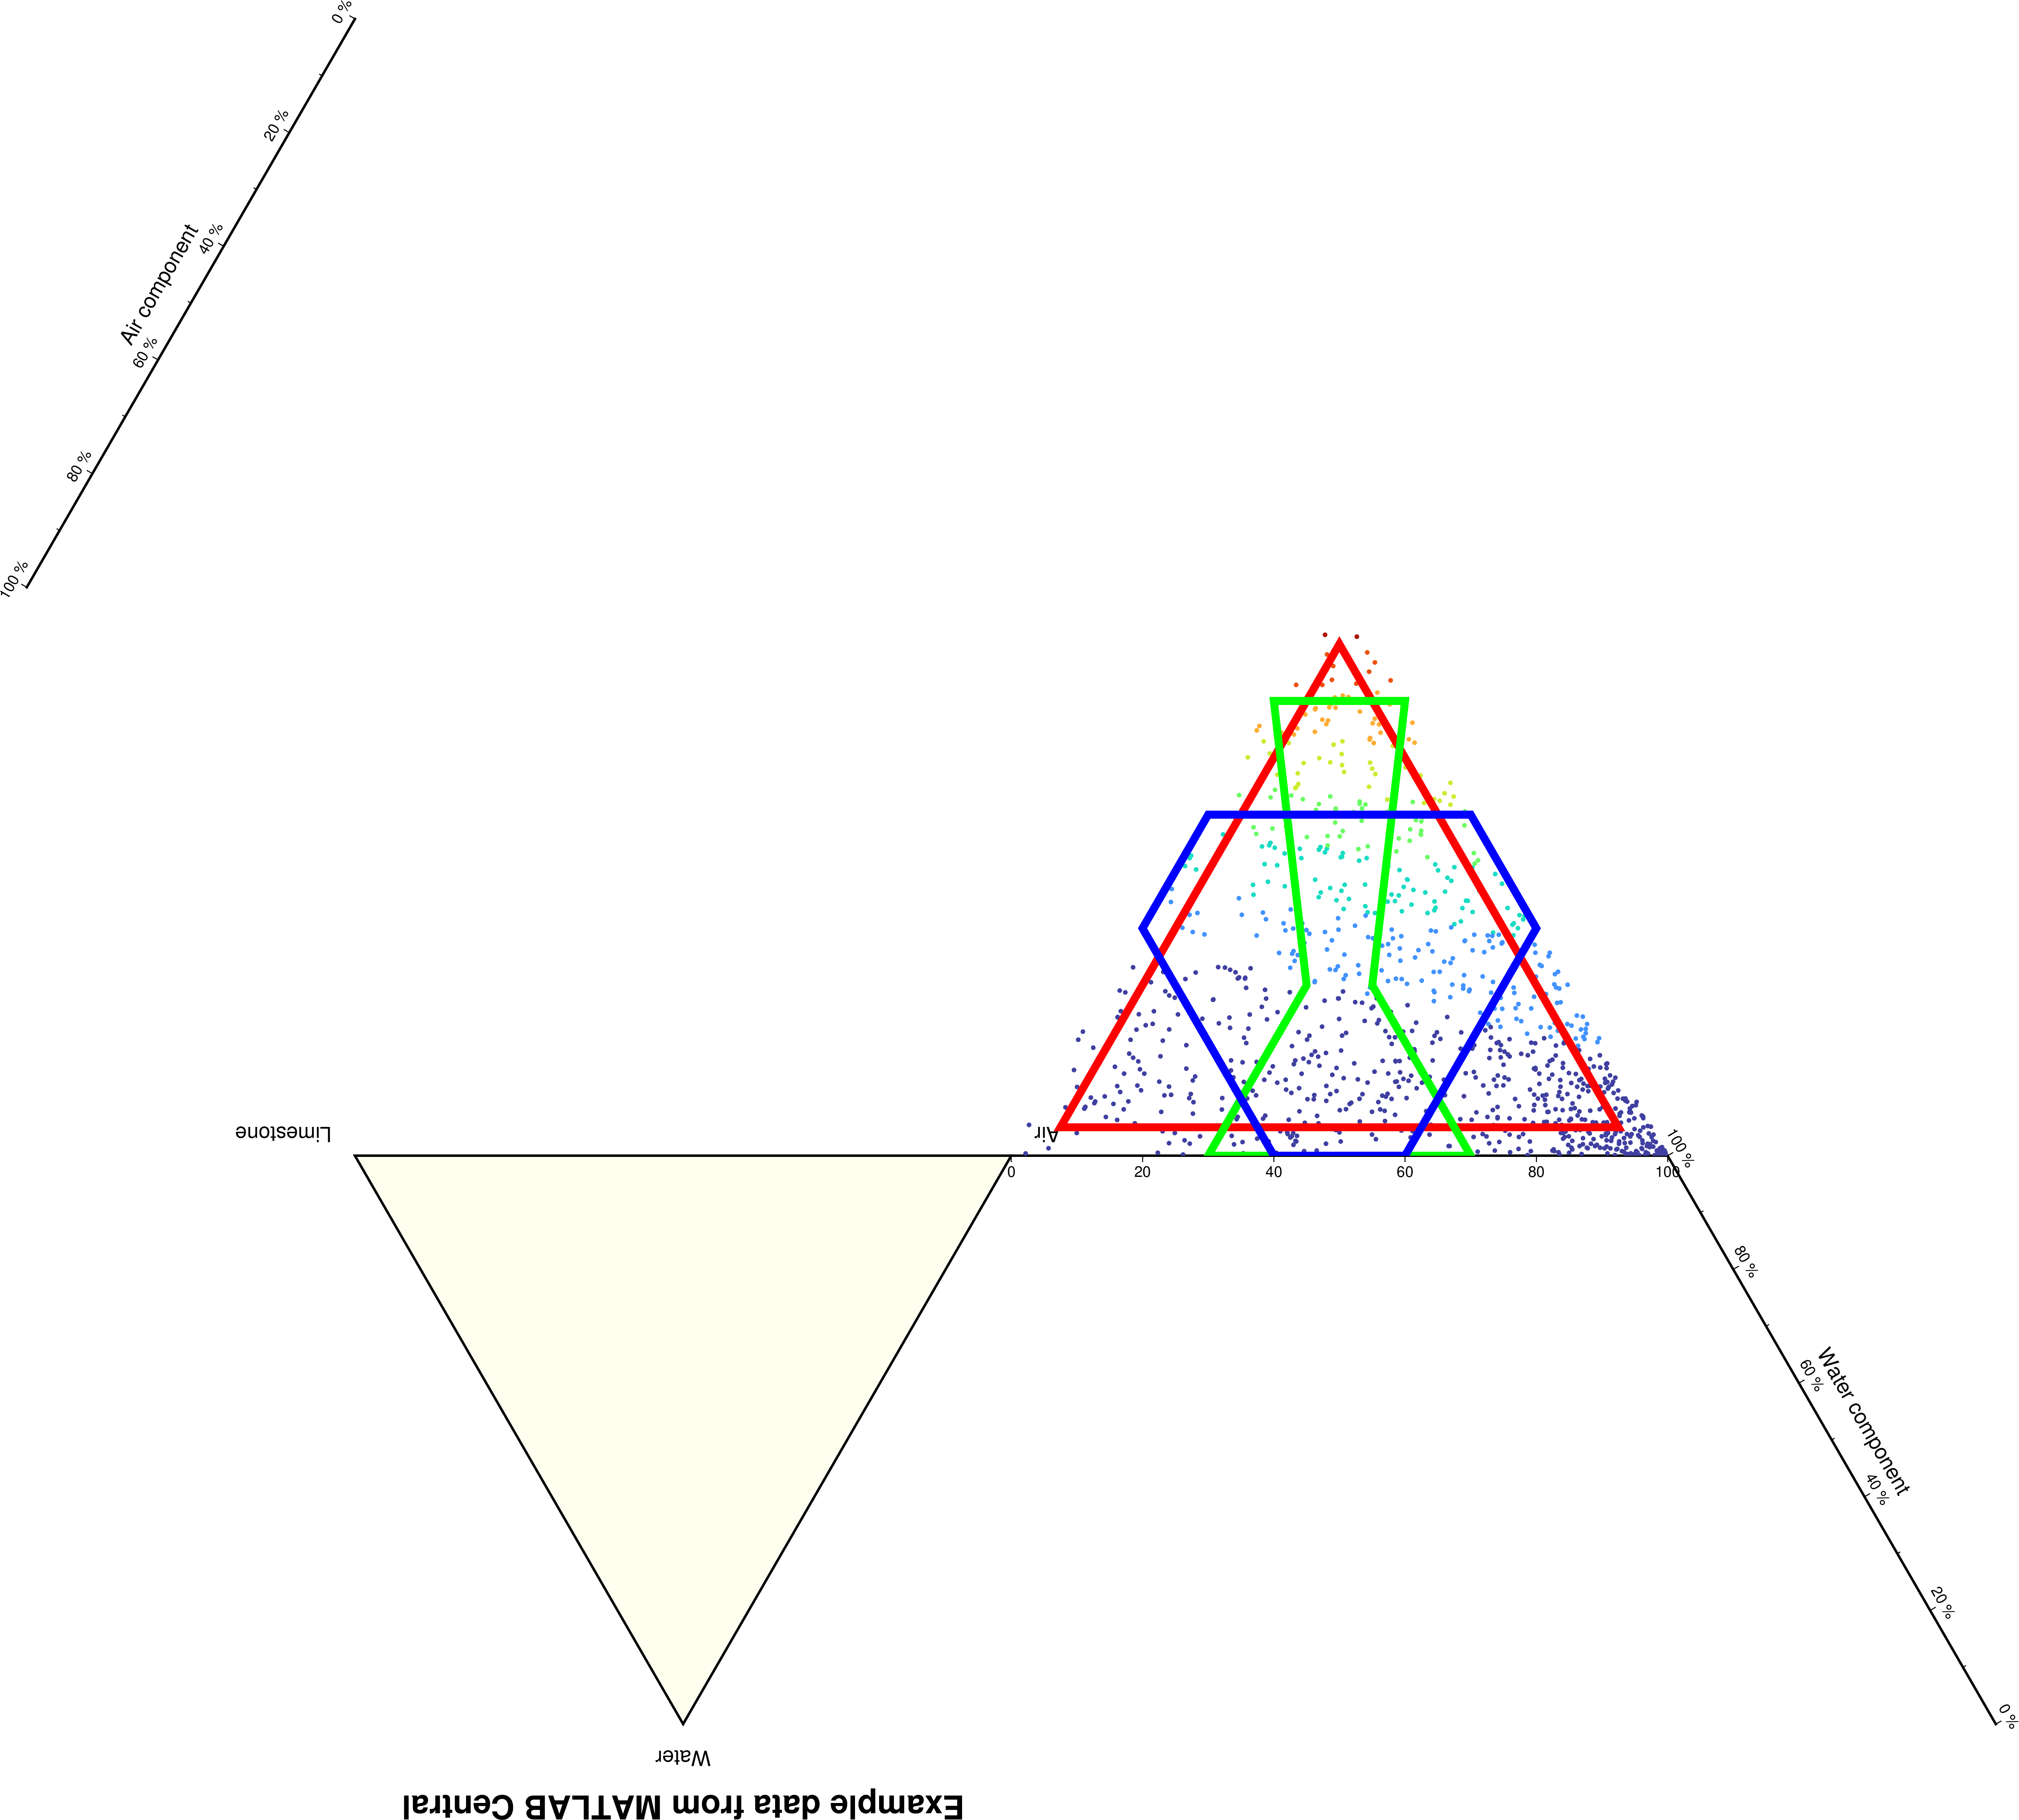
I want to make a AFP diagram with the field labels and lines included, with the ternary inverted (i.e. the bottom half of this https://www.mindat.org/photo-469339.html ). I haven’t written a full script for this myself yet but I have tried plotting the lines on the example from the psternary man page.
I was trying to do this by setting up a basemap and then using psxy / psxyz to plot the fields before adding the data. However these didn’t work.
Given most of the ternary plots I’ve seen people post from GMT don’t have this type of annotation I was wondering if it is even possible?
Full disclosure I am relatively new to GMT using mostly PSXY for plots, and I have both GMT 5 and 6 installed. The other option I considered is to plot my data, which I can do relatively easily and then add the lines in inkscape afterwards, but I sort of wanted to do it all within GMT to learn the right structure and expand the functions I can use.
calling gmt ternary ternary_lines.txt without -C fails plotting the lines silently
cat ... | gmt ternary -W1p produces the following error message:
plot [WARNING]: Representation of pen color (@GMTAPI@-S-I-D-D-L-N-000000) not recognized. Using default.
plot [ERROR]: Cannot find file 1p
ternary [ERROR]: Unable to plot lines
so the plotting lines on a ternary diagram is definitely possible.
how to plot a second ternary diagram upside down remains unclear to me.
Is there a way to do the following with ternary diagrams?:
Make all annotations horizontal (not axis labels, but the gridline labels from -Baa10fg. --MAP_ANNOT_OBLIQUE=lat_horizontal doesnt do anything.
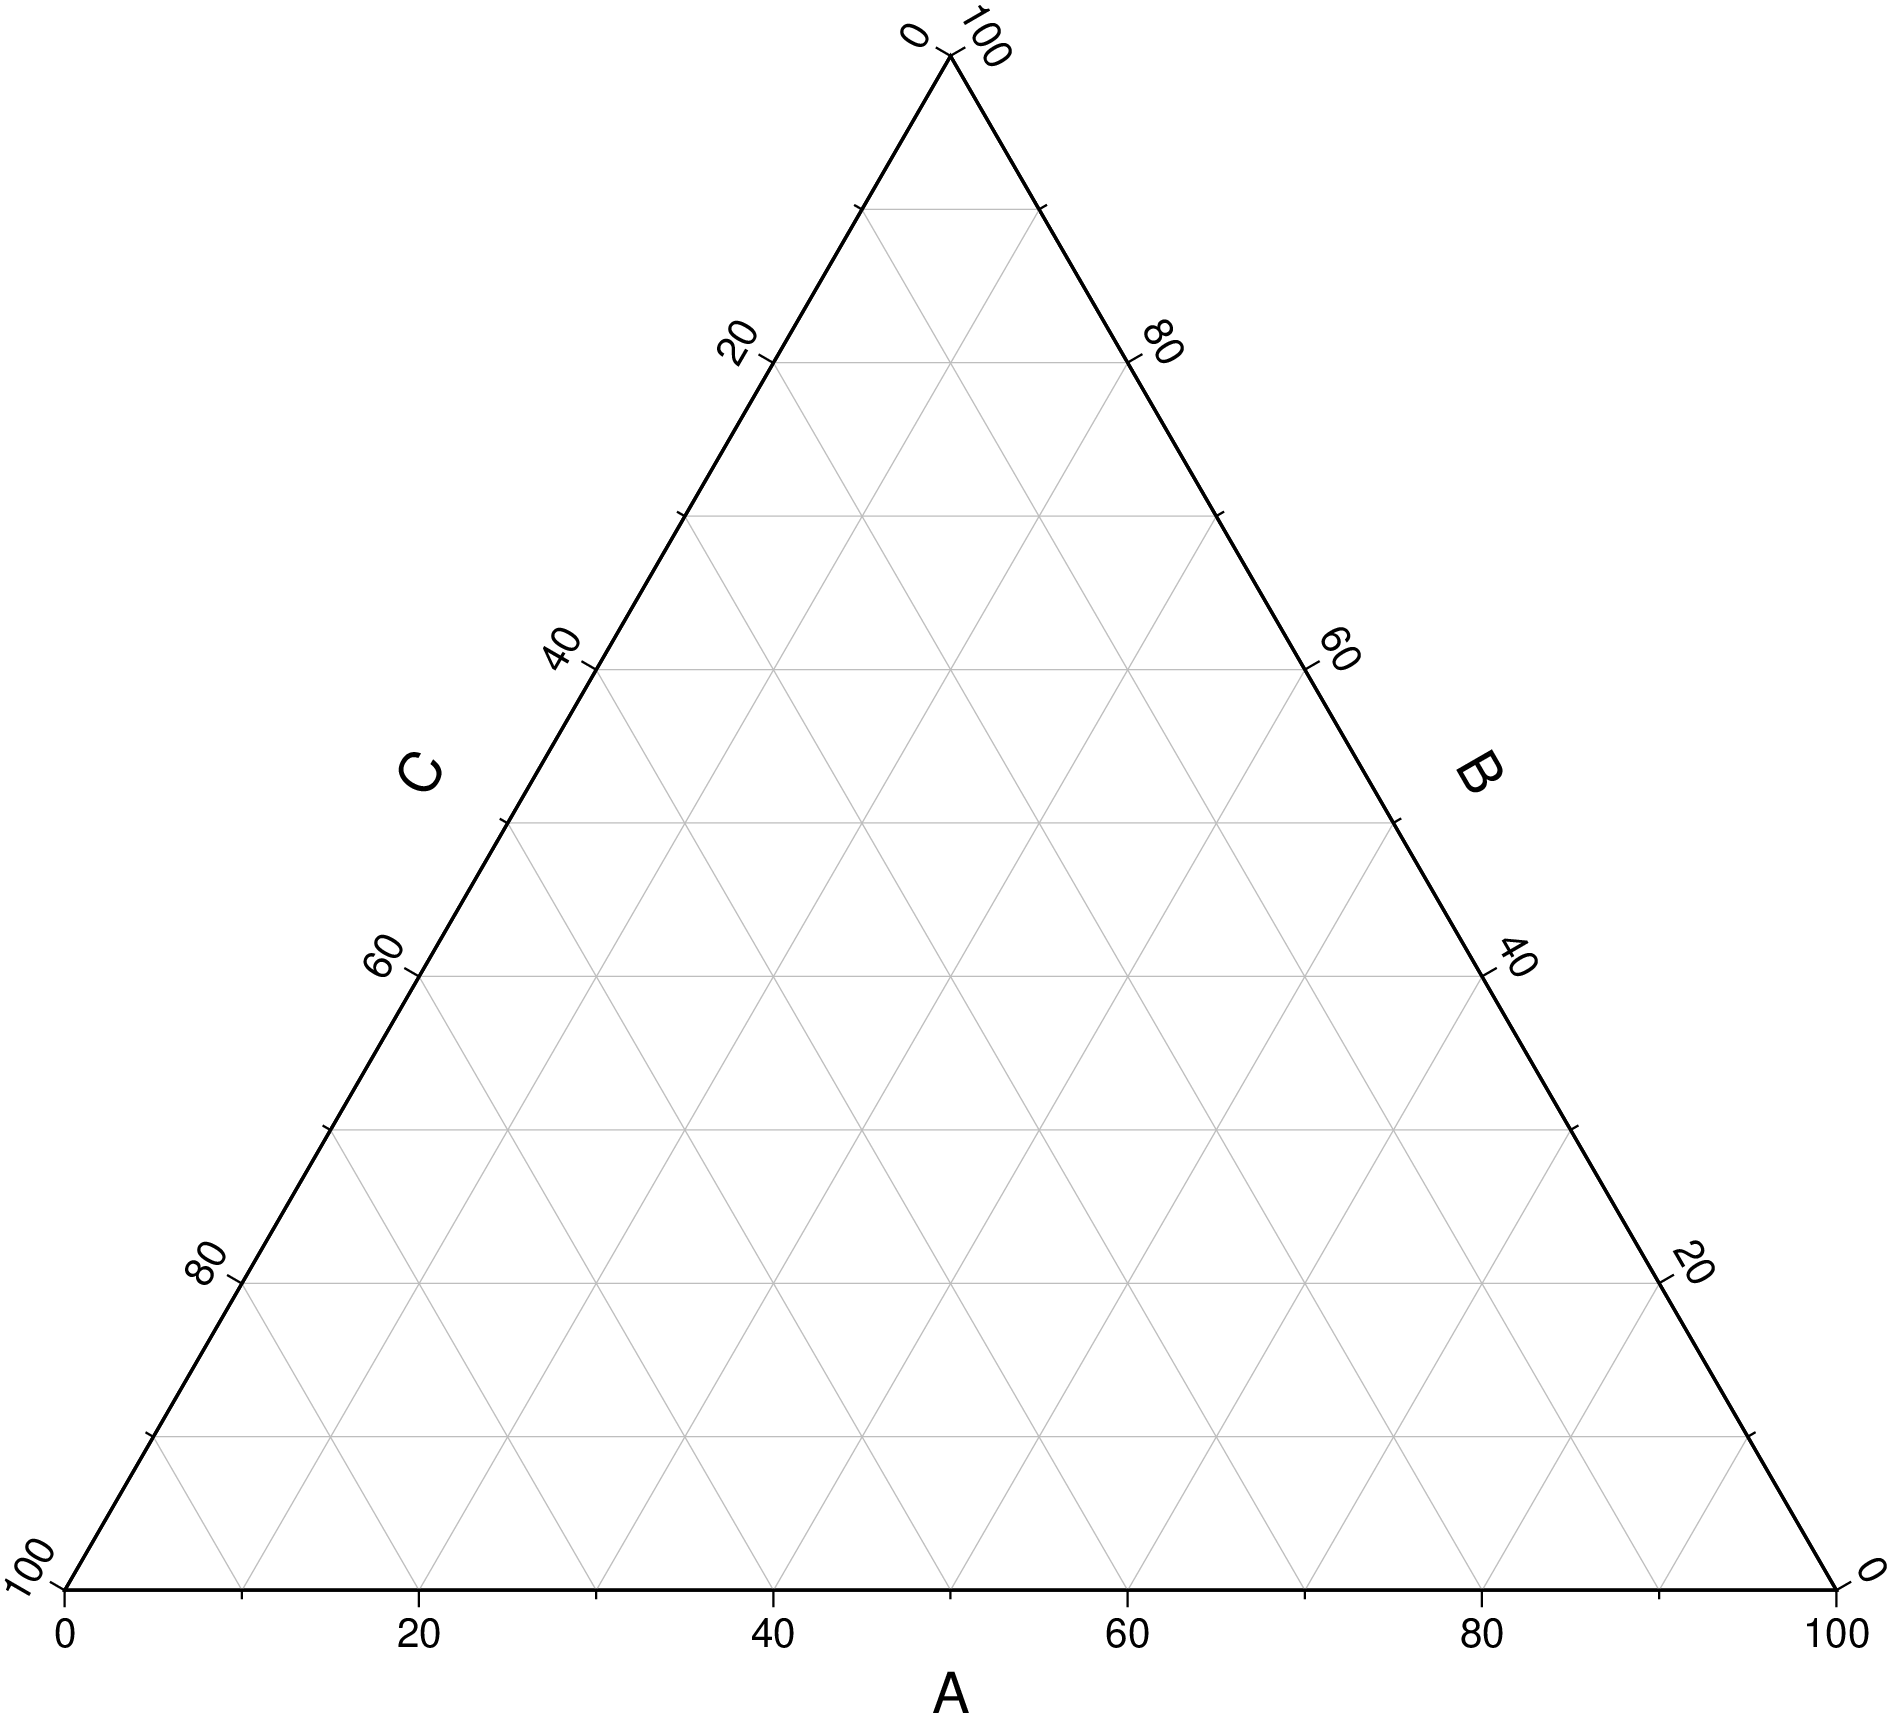
Make a blank ternary diagram the same way you can make a blank plot with basemap instead of calling plot? Yes, you can make an arbitrary file and plot it with a symbol size of 0 (strangely doesnt work for gmt ternary @ternary.txt -R0/100/0/100/0/100 -JX5i -Sc0.0c -LLimestone/Water/Air -Baa10fg+l"Limestone component"+u" %" -Bba10fg+l"Water component"+u" %" -Bca10gf+l"Air component"+u" %" -B+givory+t"Title".
I’m afraid the annotation angles are not responding to -B+a either. The GMT.jl port of ternary is way more reach but it seems not able to do this too. See examples at
One thing I wanted implemented was a way to set the annotations angle follow the direction parallel to the axis is respects.
My (semi-failed) attempt with GMT.jl (Vd=1 makes it print the generated GMT command)