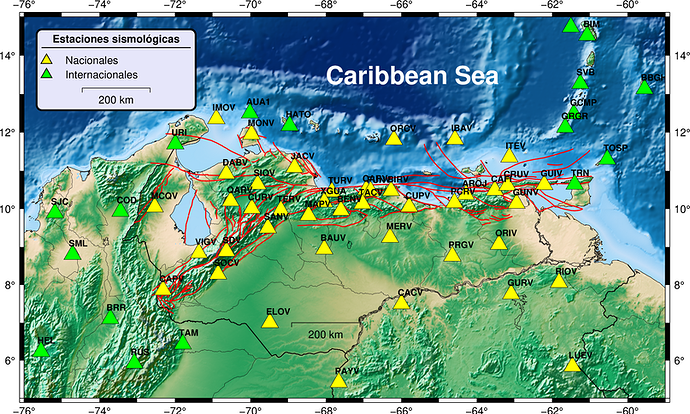
This the python code for plotting a map of seismic stations using PyGMT .
- Ubuntu 18.04, Python 3.7.8, GMT 6.0.0 and pygmt 0.1.2
#!/usr/bin/env python3
"""
Created on Wen Aug 26 15:10:59 2020
Script python plot seismic stations
Files required:
1. ESTACIONES.txt (National stations)
2. ESTACIONES_NOFUNV.txt )(international stations)
3. etopo1_bedrock.grd (topography)
4. verde.cpt (color palette)
5. legend_estaciones.txt (legend)
6. fallas2015.txt (file with faults)
"""

import pandas as pd
import pygmt

#Seismic stations
national=pd.read_csv("ESTACIONES.txt", sep='\s+')
internat=pd.read_csv("ESTACIONES_NOFUNV.txt", sep='\s+')

#Map generation wit PYGMT
KWARGS = dict(grid='etopo1_bedrock.grd', region=[-76,-59,5,15], projection='M10i',
                      cmap='verde.cpt', frame=0)

fig = pygmt.Figure()

#plot topography
fig.grdimage(shading=True,  **KWARGS)  # Add illumination!

#plot map (pscoast)
fig.coast(shorelines=True, borders=['1/0.8p','2/0.1p'],frame=True,
              map_scale='-68.0/7.0/7.0/200 ', resolution='f')

#Plot seismic faults
fig.plot(data="fallas2015.txt",pen="1,red")

#stations
fig.plot(x=national.Lon, y=national.Lat,style="t0.8c",color='yellow',
        pen="black")

fig.text(textfiles=None,x=national.Lon-0.1, y=national.Lat+0.3, position=None,text=national.COD,
 angle=0, font='10p,Helvetica-Bold,black', justify='LM')

fig.plot(x=internat.Lon,y=internat.Lat,style="t0.8c",color='green', pen="black")

fig.text(textfiles=None,x=internat.Lon-0.1, y=internat.Lat+0.3, position=None,text=internat.COD,
angle=0, font='10p,Helvetica-Bold,black', justify='LM')

#text
fig.text(x=-68.0, y=13.5,position=None,text='Caribbean Sea', angle=0,
        font='28p,Helvetica-Bold,white', justify='LM')

#Legend
fig.legend(spec='estaciones_legend.txt', position='JTL+jTL+o0.5c+w6.3/3.2',
       box='+glavender+p2p+r')

fig.savefig('stations_map.png')
