I have an oblique rectangular domain, where I would like to plot a 2D data on top of topography.
I am playing with the domain in a Cartesian coordinate system:
Topography:

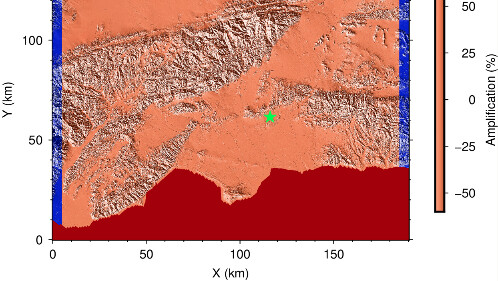
Data:

What I am doing is finding out all Ocean areas in the topography, and try to mask them out in plotting the data, as seen in the bottom in the figure below. My approach is creating a grd file with NaNs for Ocean areas, then blending it with the data.grd:
gmt grdblend temp.grd coast_mask_extlarge.grd -Cu -I0.02/0.02 -Gtemp2grd
which, however, totally messed up my colormap.
With coast command, we can select this Ocean area (the bottom red part) and fill in some color, but how to do it in this Cartesian plot?
Thank you!