Dear friends,
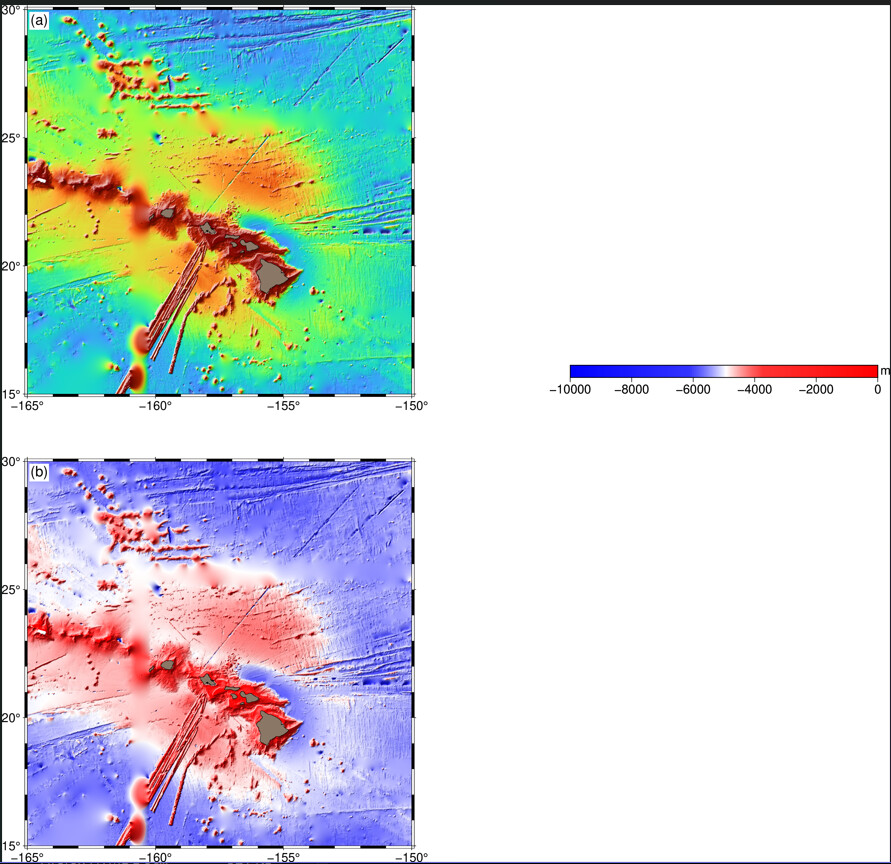
Please help me figure out the cause of the misplaced colorbars in the image below. I was expecting each colorbar to be positioned below its subplot; however, they are placed on top of each other at a weird position. I can use the offset feature in -D of colorbar to fix it, but I need to understand why this is happening; because the actual plot is a 3x3 subplot. Can someone kindly explain to me what I may be missing? I have ran it both GMT6.3.0 and 6.4.0, and the result is the same.
Below is the accompanying script.
UUUU.nc can be ETOPO1, GEBCO or any bathymetric grid around Hawaii.
Thanks very much.
gmt begin Jotter png
	gmt subplot begin 2x1 -A"(a)"+jTL+gwhite+o0.15i/0.07i -Fs6.2i/3i -M0.25i/0.4i -R-165/-150/15/30 -JQ6i
	    gmt subplot set 0
			gmt grd2cpt -Z UUUU.nc -L-10000/0 -Cturbo
			gmt grdimage UUUU.nc -I+d
			gmt coast -Gpeachpuff4 -Df -Wthinnest
			gmt colorbar -DJBC -Bx2000 -By+lm
		gmt subplot set 1
			gmt grd2cpt -Z UUUU.nc -L-10000/0 -Cpolar
			gmt grdimage UUUU.nc -I+d
			gmt coast -Gpeachpuff4 -Df -Wthinnest
			gmt colorbar -DJBC -Bx2000 -By+lm
	gmt subplot end
gmt end show