Dear PyGMT Community,
I have been working on visualizing land subsidence results from Sentinel 1 SLC data using PyGMT. Specifically, I have a single-band TIF file representing subsidence, and I’m trying to overlay it on a basemap. While I have attempted this using the following code
minlon, maxlon = 67.75, 68.40

minlat, maxlat = 25.33, 26.10

fig = pygmt.Figure()

fig.basemap(region=[minlon, maxlon, minlat, maxlat], projection="M6i", frame=True)

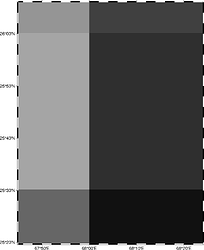
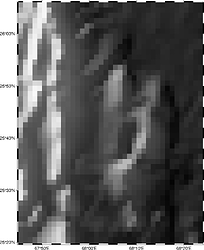
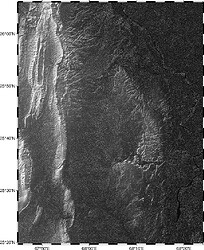
fig.grdimage("@earth_relief_30m", shading=True, cmap="gray")

grid = "deform_in_mm.tif"

fig.grdimage(grid, cmap="jet", shading=True, frame=True)

fig.colorbar(frame=["x+lDeformation (mm)", "y+lmm"])

fig.savefig("surface_deformation.png", dpi=300)

fig.show()
I am not entirely satisfied with the visualization. The background doesn’t look as polished as I would like. Could anyone provide suggestions please on how to enhance the visualization and make the background more appealing?
Any guidance or tips would be greatly appreciated.
Thank you,


