"I want to plot a hovmoller diagram using a depth-time series netcdf file. In plot, time axis will be in X axis and depth axis will be in Y axis (I am giving an example plot here). Is it possible in pygmt…?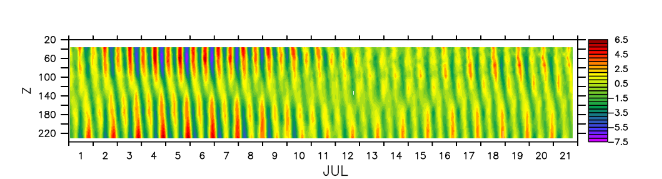
Yes it is.
You want to use grdimage with a cartesian projection. You can specify « T » (for absolute time) to the x-axis.
I appreciate the replay. I am new to pygmt. If you have any example code, it would be very appreciated if you could offer it.
I don’t use the python wrapper myself,
But you have the doc :
And the examples from the gallery.
I believe the code looks somehow like this :
ˋˋ fig_ref.grdimage("myfile.nc", projection="X20T/10c", cmap="vik") ˋˋ
Thank you; the code executed well; the only issue is that the time axis I plotted using the time axis as a absolute value . Can we use anything as an axis for time?Here, I’m Including the Sample Code.
import xarray as xr
import numpy as np
import pandas as pd
import pygmt

# creating a sample data poits
ds = xr.Dataset(
    {"v": (("depth", "time"), np.random.rand(4, 25))},
    coords={
        "depth": [10, 20, 30, 40],
        "time": pd.date_range("2015-01-01", periods=25),
    },
)
ds=ds.v
t=ds.time

#converting time as absalute value
t = (t - t.min())  / np.timedelta64(1,'D')
t=t.data
ds['time']=t

#plot
fig = pygmt.Figure()
fig.grdimage(
    ds,
    region=[t.min(), t.max(), 0, 40],
    projection='X3i/1i',
    cmap='inferno',
    frame=True
    )
fig.show()
Hello @shereef,
thanks for providing your script! Can you please format it as code using three backticks (```) in the lines before and after the block with the script:
```
your script formated as code
```
Then people can simply copy/past your code  .
.
Thanks again. I’m encountering this error while running the code. “ufunc ‘add’ cannot use operands with types dtype(‘float64’) and dtype(’<m8[ns]’)”.
import xarray as xr
import numpy as np
import pandas as pd
import pygmt
import datetime

# creating a sample data poits
ds = xr.Dataset(
    {"v": (("depth", "time"), np.random.rand(4, 25))},
    coords={
        "depth": [10, 20, 30, 40],
        "time": pd.date_range("2015-01-01", periods=25),
    },
)
fig = pygmt.Figure()
fig.grdimage(
    ds.v,
    region=[[datetime.date(2015,1,1), datetime.date(2015, 1, 25),10,40]],
    projection='X3i/1i',
    cmap='inferno',
    frame=True
    )
fig.show()