Hi,
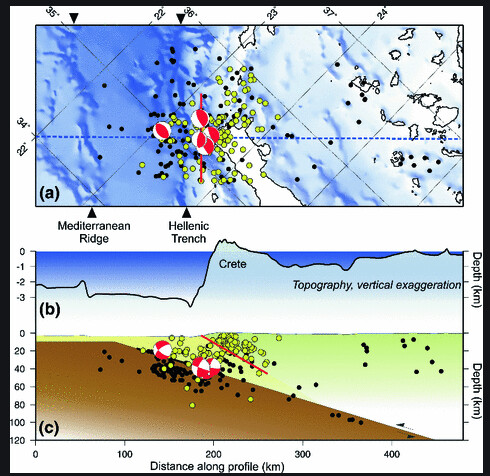
I am a beginner in PyGMT, can you help with this question: How to plot earthquake depths as a function of distance? Do you have any code that help me to have idea in this kind of plots?
Thanks,
Hi,
I am a beginner in PyGMT, can you help with this question: How to plot earthquake depths as a function of distance? Do you have any code that help me to have idea in this kind of plots?
Thanks,
Are these examples from the documentation gallery what you linking for?
fig.plot(x,y, --options--)
I had seen them. With these examples I learnt how to plot the earthquakes in the map. However, I didn’t find any clear example to do a profile line (something like in the image)?

I’m finding related answer of this question, too.
Now my workaround way to do this, is to use subprocess module to excute external shell command to generate the profile data, and then use fig.plot() to do the remain steps.
I still hope that pygmt will officially support this feature in near future.
a = subprocess.run(['awk','{print $3,$2,$4,$5,$1}',f'{event_data}'],stdout=subprocess.PIPE)
b = subprocess.run(['gmt','project',f'-C{project_line_a[0][0]}/{project_line_a[0][1]}',f'-E{project_line_a[1][0]}/{project_line_a[1][1]}',"-Lw","-W-2/2","-Fpz","-Q"],input=a.stdout,stdout=subprocess.PIPE)
projected_string = b.stdout.decode('ascii')
projected_string = projected_string.replace('\t', ' ')
projected_data=io.StringIO(projected_string)
projected_origin_df_a=pd.read_csv(projected_data,sep=' ',header=None,names=['projected_x','depth','magnitude','timedate'])
del(a)
del(b)
Note: awk part will be replace by pandas way if I have time (?