Hi, everyone
I try to plot the geographic map for the MITgcm model which has complex grid difficult to project on map.
More information could be found here:
The model grid itself is a complex lat-lon-cap (LLC) curvilinear grid which is difficult to visualize in a regular map projections.
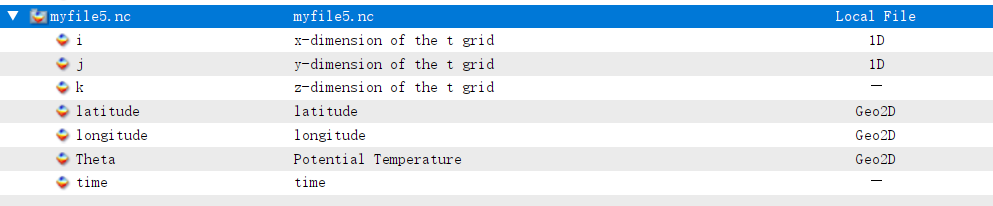
I just download the data and its’ structure seems:
You can see that the data have latitude and longitude as the 2D variables instead of 1D dimensions.
The data could be shown using JX projection:
gmt begin Aghulhas png
	gmt set MAP_ANNOT_OBLIQUE 0
	gmt grd2cpt myfile3.nc?Theta -Cjet -Z
	gmt grdimage myfile3.nc?Theta -I+a90  -R1000/2000/2500/3500 -JX15/13c -B100
	gmt colorbar -DJRM+o1.c/0+mc -I0.3 -Bx2+lTheta -By+ldegree
gmt end show
So, is it possible to plot geo-map for this kind of data?
Dose anyone have suggestions for this question?
Thanks
Lei
I crop a small file (LLC4320). Anyone who interests this question could find the data here: https://www.jianguoyun.com/p/DYpRAn0Q2PCQBxijq9AEIAA
Please trying this code:
gmt begin Aghulhas2 png
	gmt set MAP_ANNOT_OBLIQUE 0
	gmt grd2cpt myfile_sa.nc?Theta -Cjet -Z
	gmt grdimage myfile_sa.nc?Theta -I+a90  -R2000/4500/5000/6500 -JX7/5c -B500
	gmt colorbar -DJRM+o0.5c/0+mc  -Bx5+lTheta -By+ldegree
gmt end show
This is a recurrent question. My answer to it is: use the Julia package “RemoteS” that has a function to solve exactly these cases.
1 Like
Thanks Joaquim.
I installed the Julia GMT and RemoteS. Good tools. I find you shared one good example:https://www.generic-mapping-tools.org/RemoteS.jl/dev/gallery/Aqua_sst/remotes_L2_SST/
It is similar to the LLC data structure. I will give a try based on this example.
Lei
G = grid_at_sensor("./myfile5.nc", "Theta",region=(10,40,-50,-10), inc=0.03);
imshow(G, proj=:guess, coast=true, dpi=200)
Really cool tools. Only two lines.
But I have another simple question: where or how dose Julia GMT save the figure?
Another suggestion:
The RemoteS seems only know the variable name as latitude or longitude, but does not check the long name or standard name. Just like the data I shared, the variable name: XC YC stands for latitude and longitude and they are presented in the long name or standard name. So it fails to use it directly.
Use figname=newname.png option
See the function online help. I must have accounted for those cases. Otherwise please open an issue.
Sorry for these short answers but I’m somewhere in an island with no computer with me.
Thanks.
I missed the online documents. It was already mentioned and fixed my question.
Now, it is very nice.
G = grid_at_sensor("./myfile4.nc", "Theta",region=(0,50,-50,-10),xarray="XC", yarray="YC", inc=0.03);