Hi! I’m new to pygmt (it’s amazing!) and have a quick question. What is the preferred way to plot multiple triangles (e.g., from a triangulated mesh) with a single fig.plot call? I’m asking because I’d like to plot 100-100k of these and looping is too slow.
A MWE of a sequential two triangle (one red and one blue) example is below. I thought a first thing to do would be to learn how to plot both of these with a single call to fig.plot.
Thoughts and guidance much appreciated!
import pygmt

fig = pygmt.Figure()
fig.plot(x=[-130, -125, -127], y=[35, 40, 39], color="red", pen="1.0p,black")
fig.plot(x=[-126, -125, -127], y=[35, 38, 37], color="blue", pen="1.0p,black")
fig.show()
I believe you want to color your triangles based on numerical values, right? If so, you can simply create a CPT file, and pass a 2D list or 2D numpy array to color.
Here are two examples that may help you:
Thanks for the CPT file suggestion. I still have a more basic question: How to structure the triangle vertex data so that I can plot these with a single call to fig.plot. Right now I do it with multiple calls but this gets too slow for thousands of triangles. Is there a way to structure the vertices so that for multiple triangles I can call like:
fig.plot(x_vertices_for_all_triangles, y_vertices_for_all_triangles, …)
I’m still looking to learn how to package the vertices for multiple triangles to work this way. Guidance much appreciated!
I thought you want to plot triangle symbols at data points, but actually what you want is plotting triangular mesh grids.
To plot multiple triangle meshes, you need to pass a multi-segments file to GMT. Unfortunately, PyGMT still lacks the Pythonic support of multi-segment files. So you have to prepare the multi-segment file manually and then pass the file name to Figure.plot().
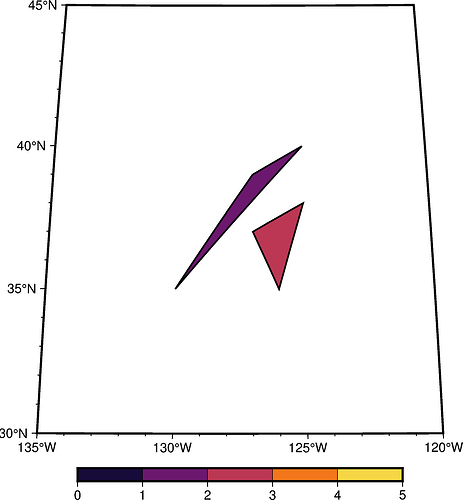
Here is an exmaple script. > -Z1 marks the start of a new segment, and -Z1 controls the zvalue (i.e., the color) for the current polygon (i.e., triangle in this example):
import pygmt
fig = pygmt.Figure()
with open("mesh.dat", "w") as fp:
    fp.write("> -Z1\n")
    fp.write("-130 35\n")
    fp.write("-125 40\n")
    fp.write("-127 39\n")
    fp.write("> -Z2\n")
    fp.write("-126 35\n")
    fp.write("-125 38\n")
    fp.write("-127 37\n")
pygmt.makecpt(cmap="inferno", series=(0, 5, 1))
fig.basemap(region=[-135, -120, 30, 45], projection="H10c", frame=True)
fig.plot(data="mesh.dat", pen="1p", close=True, color="+z", cmap=True)
fig.colorbar()
fig.show()
Here is the output:
1 Like
Thank you so much for this response. This makes total sense and is a very cool way to do this. Thanks!
I am glad I found this Forum posting. I was trying to figure out how to get PyGMT to read a GMT multi-segment file and I could not find it in the documentation. It is so easy to just pass the filename of the file. I was thinking I would need to do my own parsing to get it into the X and Y arrays, but it is already in there.
