Hi, all
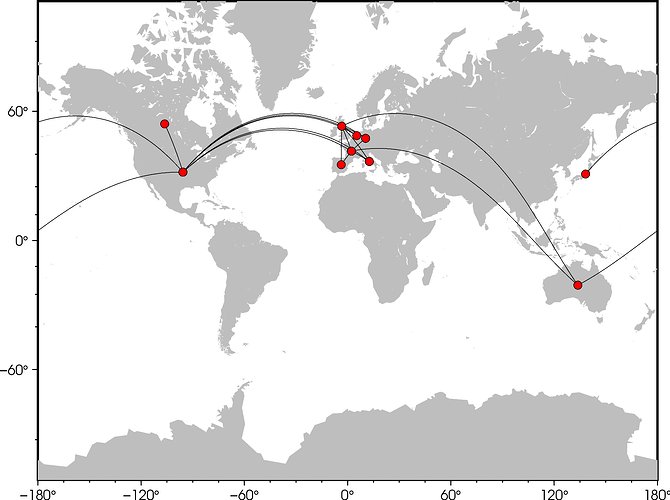
Could GMT read following format and plot network from points (First -second columns) to points (third-fouth columns)? And the line width is set by the last column.
Latitude	Longitude	Latitude	Longitude	Frequency
37.09024	-95.712891	35.86166	104.195397	351
37.09024	-95.712891	46.227638	2.213749	336
37.09024	-95.712891	55.378051	-3.435973	218
37.09024	-95.712891	51.165691	10.451526	150
46.227638	2.213749	55.378051	-3.435973	131
46.227638	2.213749	51.165691	10.451526	121
55.378051	-3.435973	51.165691	10.451526	116
46.227638	2.213749	41.87194	12.56738	113
37.09024	-95.712891	56.130366	-106.346771	110
37.09024	-95.712891	-25.274398	133.775136	107
46.227638	2.213749	40.463667	-3.74922	103
55.378051	-3.435973	41.87194	12.56738	90
37.09024	-95.712891	36.204824	138.252924	83
37.09024	-95.712891	52.132633	5.291266	81
55.378051	-3.435973	-25.274398	133.775136	80
37.09024	-95.712891	41.87194	12.56738	78
...
And the map looks:
yes, but you have to send the data to plot in the format it expects.
I would do something like :
awk ‘NR>0{printf(">-W%.2fp,red\n%s\t%s\n%s\t%s\n",$5/1e2,$1,$2,$3,$4)}’ datafile.dat | gmt plot
Here’s a start. Does not not take into account the width in the last column.
I thought I could do both line and point within the same loop, but got into problems.
gmt begin lines png

gmt set GMT_THEME minimal

gmt psbasemap -B -JM15c -R-180/180/-80/80
gmt coast -Ggray

# plot lines
while read line;
do
awk '{ printf "%s %s\n%s %s\n", $2,$1,$4,$3}' | gmt plot -W
done < data

# plot red dots
while read line;
do
awk '{ printf "%s %s\n%s %s\n", $2,$1,$4,$3}' | gmt plot -Sc0.2c -Gred -W
done < data

gmt end show
Might work directly on the file with -S=1p+s I think. We have no mechanism for changing the pen thickness but you could do something like
awk ‘{ printf “> -W%gp\n%s\n”, $5*0.01, $0}’ | gmt plot -S=1p+s -Vthin …
where you would have to figure out a good scale (here 0.01 was used) for scaling your frequency to pen width in points.
A question regarding -R: It’s not possible to give an -R of, say, -R0/720/-80/80 that would ‘print the world’ two consecutive times, right? Maybe this would be nice for some plots.
$ gmt coast -pdf test -R0/720/-80/80 -W
coast [ERROR]: Map region exceeds 360 degrees
coast [ERROR]: General map projection error
I know, but too hard to change for us. Just do it with two plots.
I see.
gmt begin worldx3 png

gmt set GMT_THEME minimal

gmt coast -W -JM10c -R0/360/-70/70 -BWSN
gmt coast -Wred -JM10c -R0/360/-70/70 -X10c -BSN
gmt coast -Wblue -JM10c -R0/360/-70/70 -X10c -BSEN

gmt end show
Just in case. You could use -Xw (instead of -X10c).
Thanks all !
I can figure out this using other tools (this one is used Bibliometrix). But, I am always looking for the possibility to use GMT to do this. Maybe I believe GMT can produce more beautiful maps.
Sorry. I am wrong.
Bibliometrix:https://www.bibliometrix.org/
Thanks Esteban. I never knew about this, and it is a bit buried in the docs. I see that it applies only to modern mode.
1 Like


