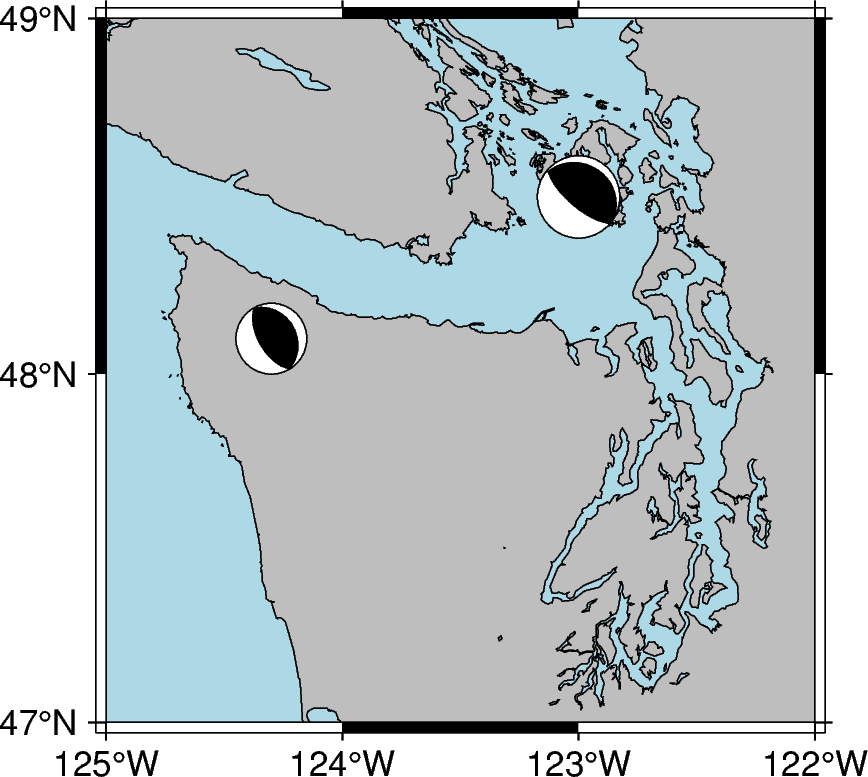
Hello guys ! Im new on using pygmt and I’m trying to plot multiple focal mechanisms using meca() method, if someone can share a simple code explanation that would be great. thanks in advance !
Hello @geoexplo,
thanks for trying out PyGMT!
There are already some topics related to focal mechanisms ![]() , e. g. https://flint.soest.hawaii.edu/t/plot-focalmechanims/2266
, e. g. https://flint.soest.hawaii.edu/t/plot-focalmechanims/2266
There is also a PyGMT gallery example for the aki convention: Focal mechanisms — PyGMT
For the other conventions, please have a look in the documentation: pygmt.Figure.meca — PyGMT
Please find below a modification of this gallery example for two focal mechanisms. Additionally, two ways of providing the focal mechanism data are shown (I) passing a dictionary (II) reading from a file.
The file with focal mechanism data gmt_meca_aki.txt (137 Bytes) has to be placed in your working directory.
# source: https://www.pygmt.org/dev/gallery/seismology/meca.html#sphx-glr-gallery-seismology-meca-py
# last access: 2022/11/15
# strongly modified


import pygmt

# store focal mechanisms parameters in a dictionary, using the aki convention
focal_mechanism = dict(
    strike=[330, 300],
    dip=[30, 20],
    rake=[90, 80],
    magnitude=[3.0, 3.5],
)

# -----------------------------------------------------------------------------
# (I) pass a dictionary to the "spec" parameter
fig = pygmt.Figure()

# generate a basic map near Washington state showing coastlines, land, and water
fig.coast(
    region=[-125, -122, 47, 49],
    projection="M6c", # Mercator projection with width 6 cm
    land="grey",
    water="lightblue",
    shorelines=True,
    frame="a",
)

# pass focal mechanism data to the "spec" parameter
fig.meca(
    spec=focal_mechanism, # <<< use dictionary
    scale="1c",
    longitude=[-124.3, -123], # event longitude
    latitude=[48.1, 48.5], # event latitude
    depth=[12.0, 10.0], # hypocentral depth
)

fig.show()
# fig.savefig(fname="meca_two_events_dict.png")


# -----------------------------------------------------------------------------
# (II) read focal mechanism data from file
fig = pygmt.Figure()

# generate a basic map near Washington state showing coastlines, land, and water
fig.coast(
    region=[-125, -122, 47, 49],
    projection="M6c",
    land="grey",
    water="lightblue",
    shorelines=True,
    frame="a",
)

# pass focal mechanism data to the "spec" parameter
fig.meca(
    spec="gmt_meca_aki.txt", # <<< read from file
    scale="1c",
    convention="aki",
)

fig.show()
# fig.savefig(fname="meca_two_events_file.png")
Output figure (same for both plots):
Thanks a lot for your answer ![]() , Actually I had problem with the format of the text file but now that you’ve shown to me how to do it, it’s working very well. Thanks a lot !
, Actually I had problem with the format of the text file but now that you’ve shown to me how to do it, it’s working very well. Thanks a lot !
