I am currently trying to create a grid which runs across the Grenwich Meridian, yet using a 360 degree grid. So in essence my region becomes 335/10/40/60.
I have an XYZ dataset which runs across these co-ordinates, and then use the surface tool to interpolate and later plot:
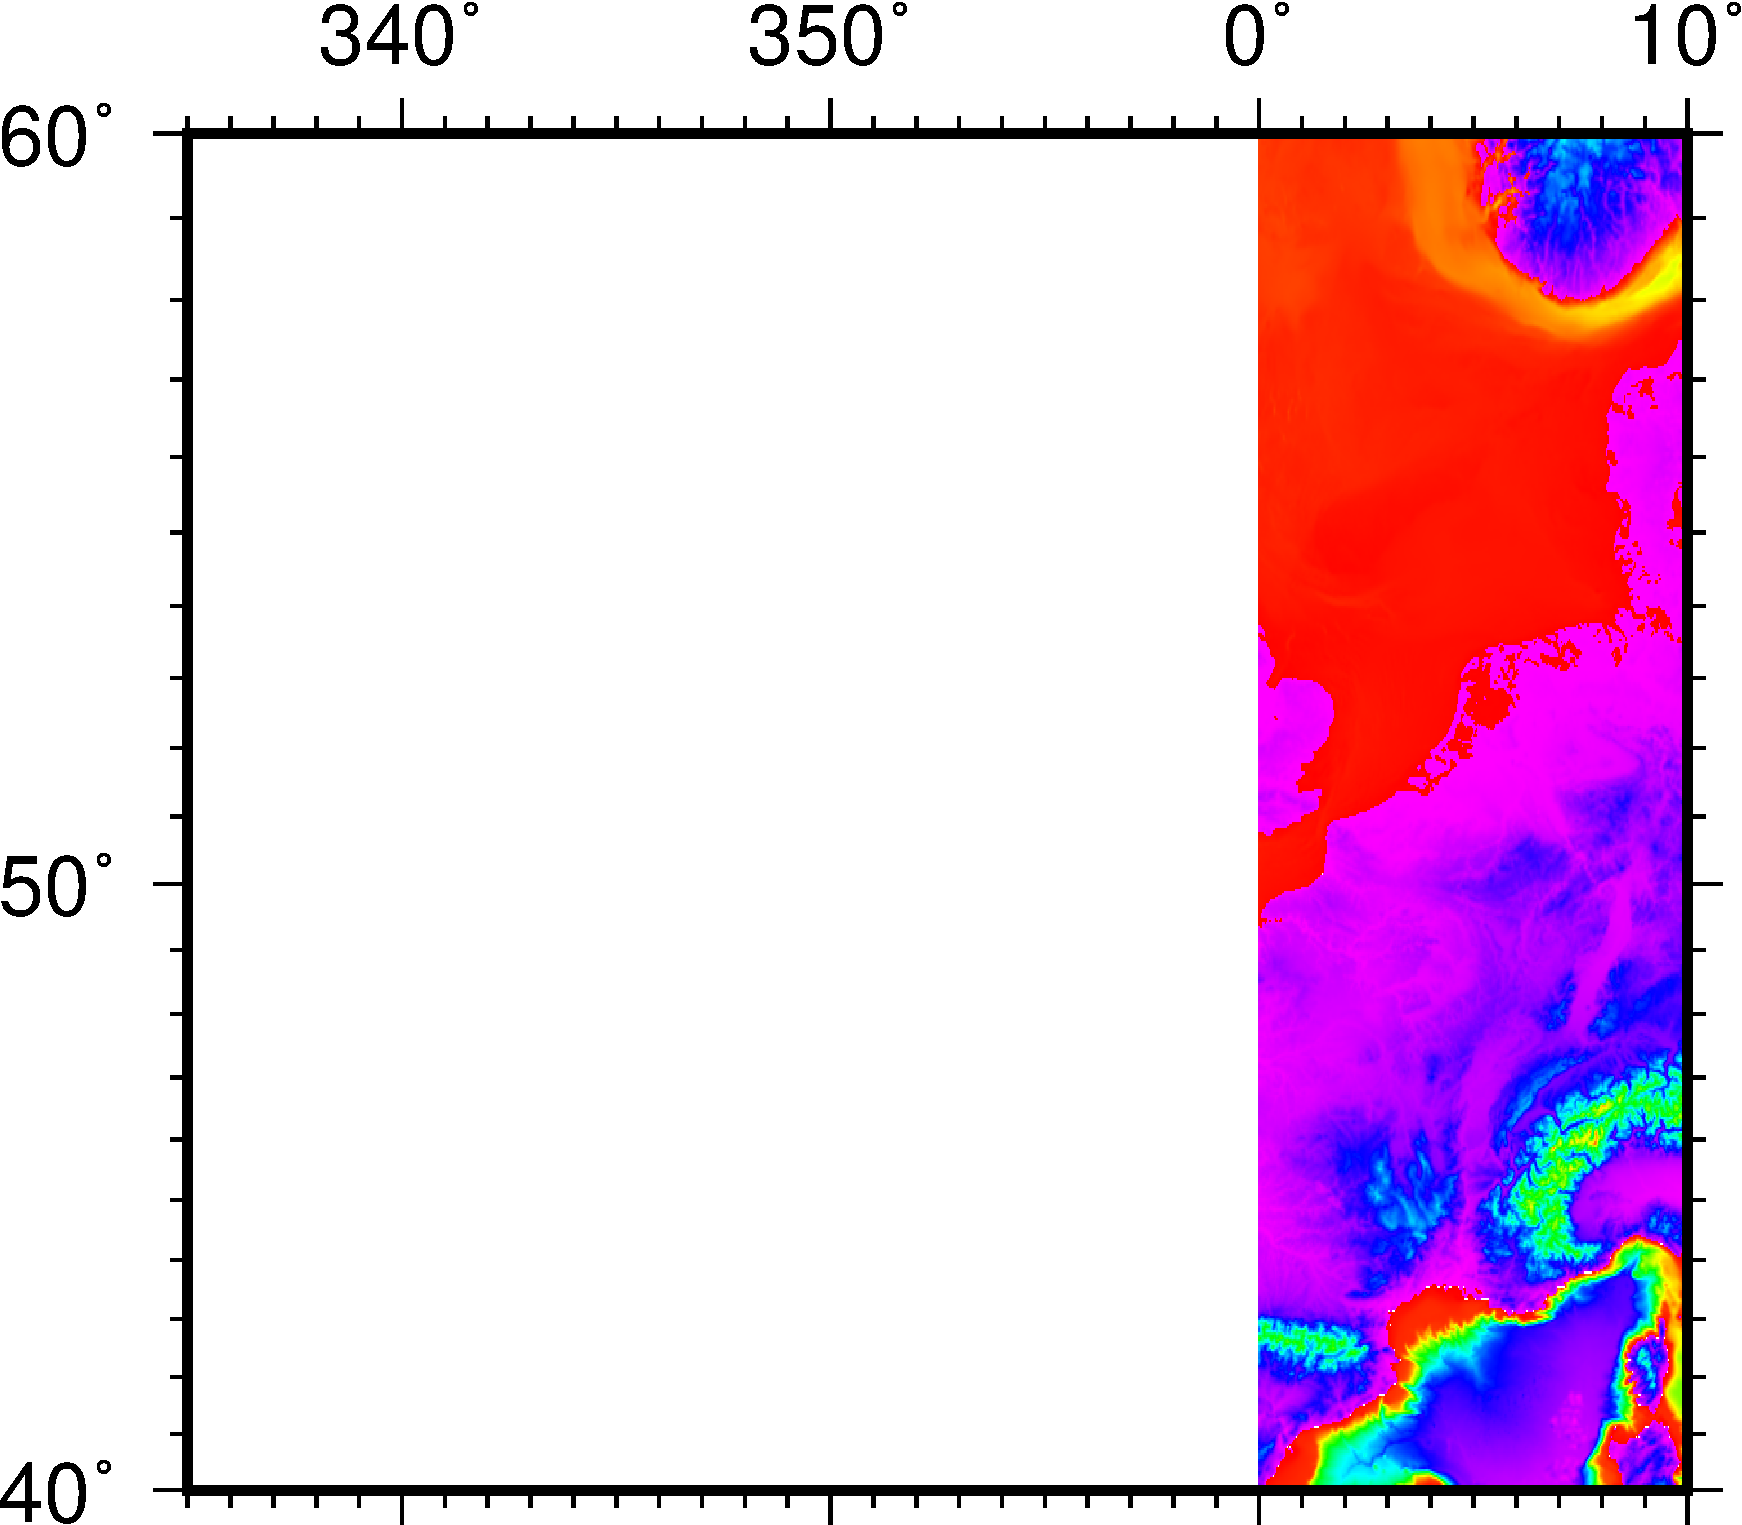
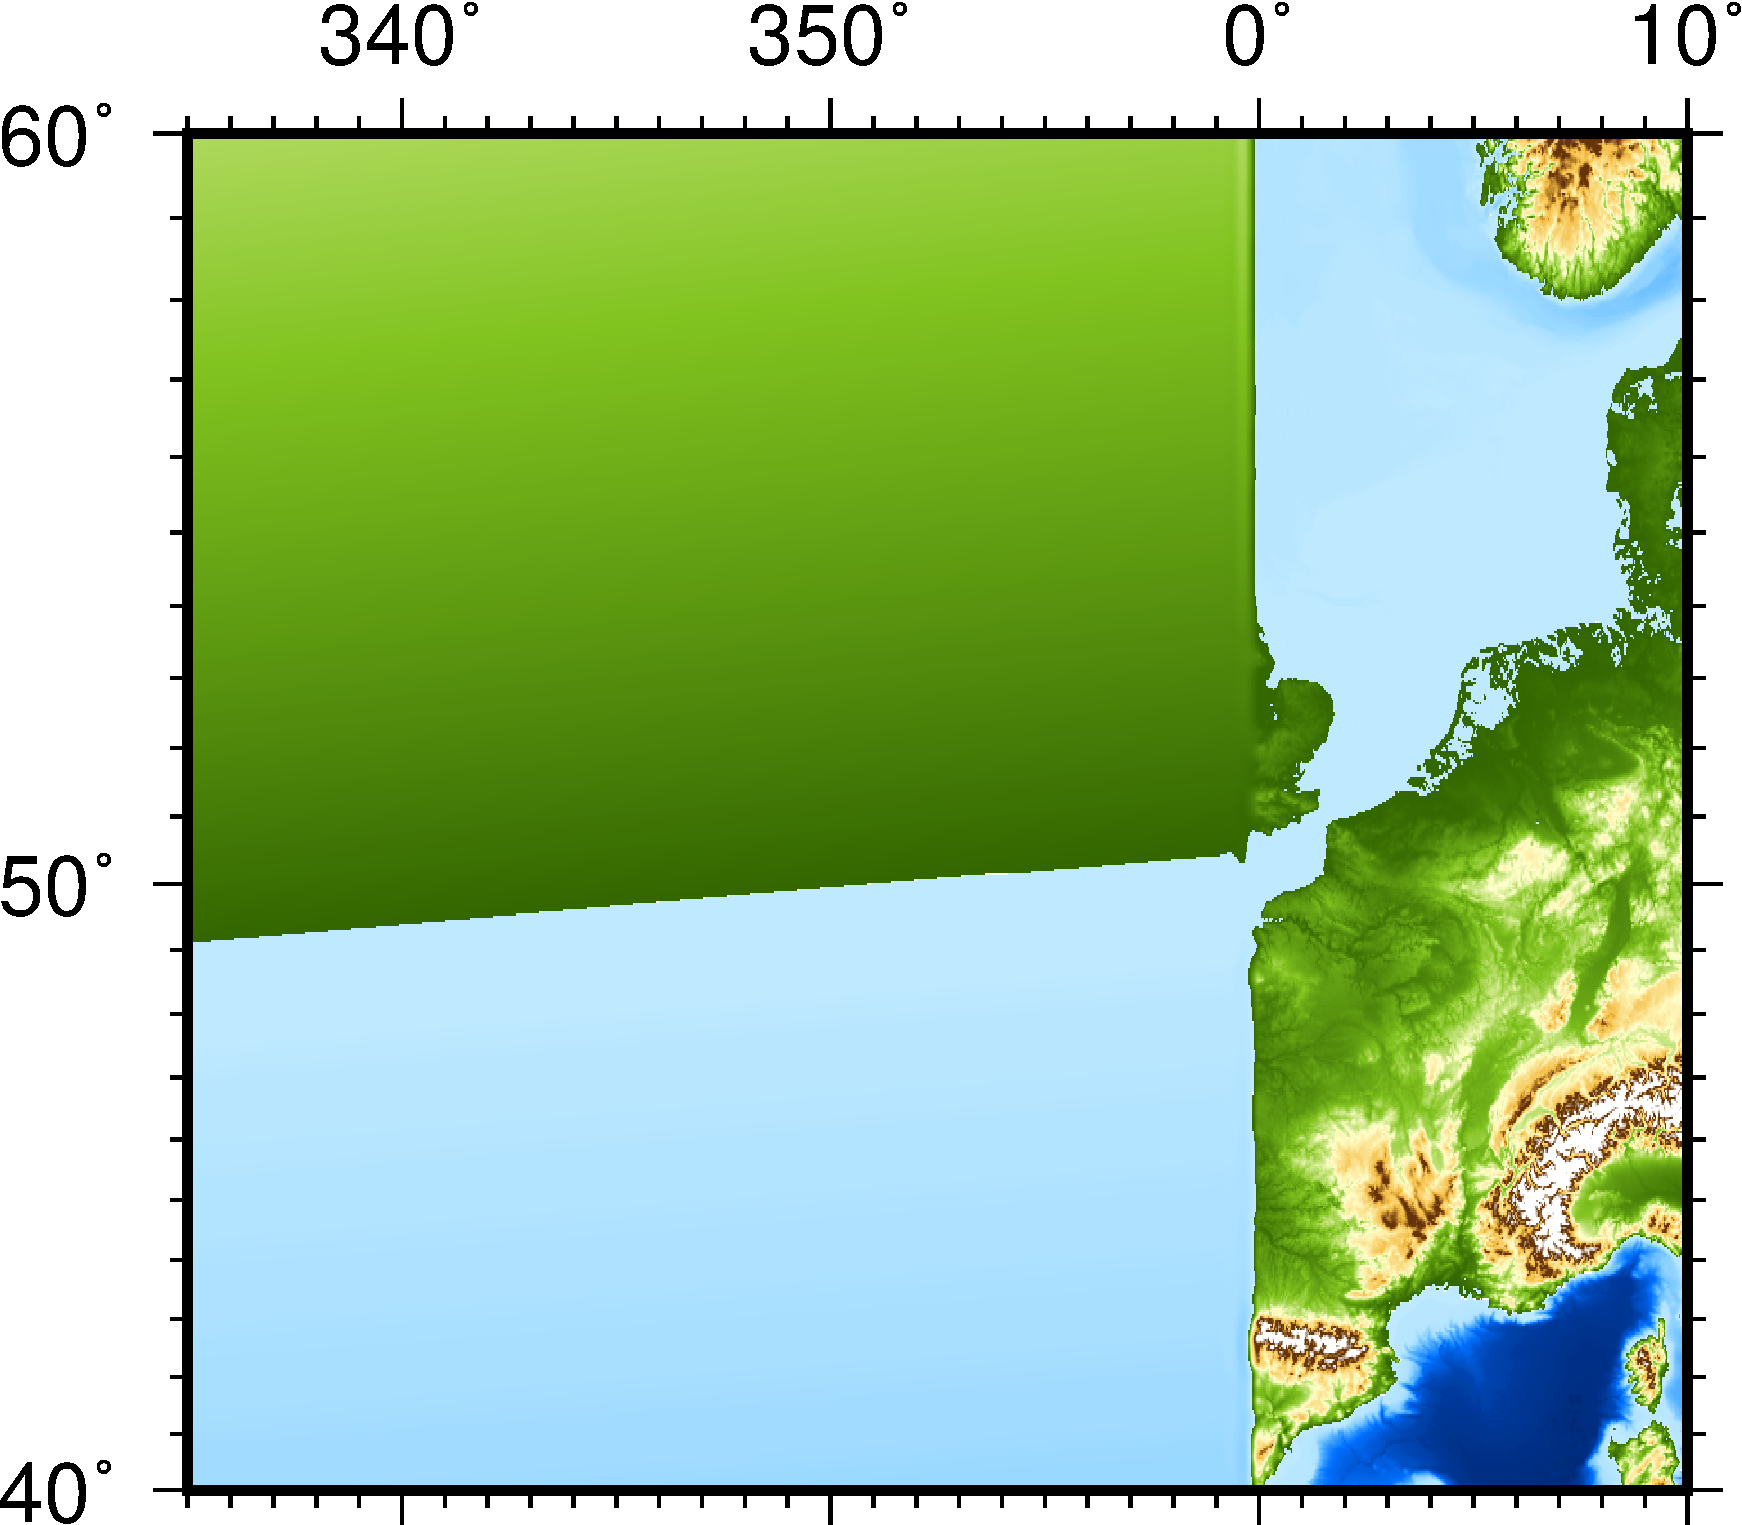
It seems that I am easily able to plot one side of the meridian (i.e 335 - 360 or 0 - 10), however not across a single image.
I have experimented with plotting as a whole with an 180 longitudinal offset, and trying to find a way to then shift it around by 180 degrees once in a .grd format.
I realise that this can be done on a 180 to -180 basis, however this is not the final output I am looking for.
Is there a way to do this, through any of the following options, in order of preference:
Plot these using the original dataset with X values ranging from 335 to 10, plotting across the zero meridian
Offset the data (outside of GMT), plot it out of longitudinal alignment, then somehow shift it within GMT into the correct longitudes
Plot on a 180 to -180 basis, and somehow change the labels of the final plot to show the 360 dgeree longitudes.
Any advice, even if it is a bit of a messy workaround, would be greatly appreciated.
If you need, I am happy to send the copy of the XYZ data, however I don’t seem to be able to attach it within this forum unless I am attaching an image.
There is no indication in your command that you want a geographic grid (with periodic longitudes) so you should add -fg. Or, you could use -I1.8m. Either way will tell GMT that you are gridding long/lat, otherwise it is Cartesian and of course nothing will work across 360.
Your grid will be continuous. Whether you want a map to plot annotations in 0-360 range or -180/180 is a separate issue. The grid still needs to have xmax > xmin in its header.
In principle I understand your solution, in that I need to change my command to ensure I am requesting a geographic grid.
I have tried both adding -fg and changing the -I to 1.8m rather than the 0.03. Both stop the surface command from producing an output.
Do you think I will need to change the input XYZ data from decimal degrees into a reprojected format such as WSG meters, currently they just look like:
Does gmt grdinfo Grid.nc -M report that there are lots of NaNs or not? If not then the grid is OK and the plotting fails. If so please post your command for making the plot.
Grid.nc: Title: Data gridded with continuous surface splines in tension
Grid.nc: Command: surface NormalGrid.txt -GGrid.nc -I0.03 -R-R-25/10/40/60
Grid.nc: Remark:
Grid.nc: Gridline node registration used [Cartesian grid]
Grid.nc: Grid file format: nf = GMT netCDF format (32-bit float), COARDS, CF-1.5
Grid.nc: x_min: 0 x_max: 10 x_inc: 0 name: x n_columns: 334
Grid.nc: y_min: 40 y_max: 60 y_inc: 0 name: y n_rows: 668
Grid.nc: z_min: -3946 at x = 8 y = 46 z_max: 2987 at x = 7 y = 41
Grid.nc: scale_factor: 1 add_offset: 0
Grid.nc: format: netCDF-4 chunk_size: 167,134 shuffle: on deflation_level: 3
Also, when using ncdump to see values for X, the range simply goes from 0 to 10, and does not show any NaNs or numbers in the 300s. However, the number of X nodes has been reduced from c. 1170 to 334.
I have also tried to plot without the -Q option flag, which should then plot NANs, which it does elsewhere but not West of 0.
Perhaps I am wrong, but to me this would suggest that there is no data West of 0?