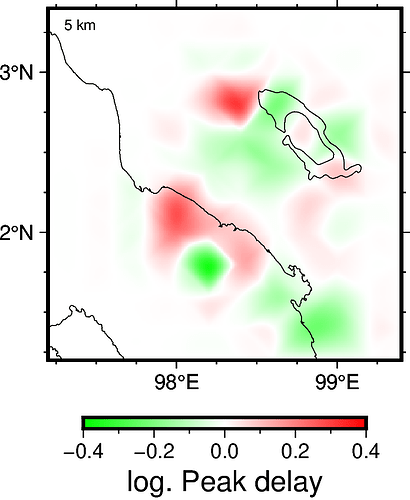
Hello everyone,
I have written following code to plot spatial data, I have done it successfully so far, except for fault line. fault_sumatra.csv contains the coordinates for fault and peakdelay_3_Degrees_Hz.txt contains the spatial data. The code does not run into any error and outputs the figure but without fault line. Could anyone help me please?
import pygmt
import pandas as pd
import numpy as np
import xarray as xr
from scipy.interpolate import griddata

datafile = '/mnt/d/Uni/Master_Thesis/GMT/TXT_NLLOC/peakdelay_3_Degrees_Hz.txt'
df = pd.read_csv(datafile,delimiter=',', names=['longitude', 'latitude', 'depth', 'peakdelay', 'number'])

## Sumatran fault coordinates =============
fault = '/mnt/d/Uni/Master_Thesis/GMT/fault_sumatra.csv'

df_flt = pd.read_csv(datafile, delimiter=',', header=None)

flt = pd.read_csv(fault, sep=",", header=None) # co-ordinates for subduction
f_lat = list(flt.iloc[:,1])
f_lon = list(flt.iloc[:,0])

#=====================================

depth_slice = -5

df_depth = df[df['depth']==depth_slice]

lons0 = np.array(df_depth['longitude'])
lats0 = np.array(df_depth['latitude'])
#depth0 = np.array(df_depth['depth'])
pd = np.array(df_depth['peakdelay'])

coordinates0 = np.column_stack((lons0, lats0))

minlon, maxlon = min(lons0), max(lons0)
minlat, maxlat = min(lats0), max(lats0)
step = 0.01

lons = np.arange(minlon, maxlon, step)
lats = np.arange(minlat, maxlat, step)

xintrp, yintrp = np.meshgrid(lons, lats)
z1 = griddata(coordinates0, pd, (xintrp, yintrp), method='cubic')
xintrp = np.array(xintrp, dtype=np.float32)
yintrp = np.array(yintrp, dtype=np.float32)

da = xr.DataArray(z1, dims=('lat', 'long'), coords={'long': lons, 'lat': lats},)

pygmt.config(MAP_FRAME_TYPE="plain")
frame = ['a1f0.25', 'WSen']

# color pallets
fig = pygmt.Figure()


lim=abs(max(-0.4, 0.4))

pygmt.makecpt(
    cmap='green,white,red', #'blue,white,red',
    series=f'-{lim}/{lim}/0.01',
    continuous=True
)
fig.grdimage(
    region=[minlon, maxlon, minlat, maxlat],
    grid=da,
    projection='M2i',
    interpolation='l'
)

fig.coast(
    region=[minlon, maxlon, minlat, maxlat],
    shorelines=True,
    frame=frame,
    area_thresh=1000
)
fig.text(x=97.4, y=3.3, text="5 km", font="6,Helvetica")

# Fault line
fig.plot(
    x = f_lon,
    y = f_lat,
    frame=frame,
    style = 'f1c/0.3c+t',
    legend=False,
    color = 'black',
    pen = '1.25p',
    label = 'fault',
    )

fig.colorbar(
    frame='+l"log. Peak delay"'
)
fig.show()

 That solved it