I’m new to python, new to obspy, and new to pygmt. I was really good at GMT4…(sigh).
I’m trying to learn how to do something simple: download a catalog of events using obspy, then plot the incoming great circle path lines at a specific station location (i.e. a single lat/lon). The trick is, I don’t want to have the map be of the entire world… I would like it zoomed in on the station, so that just the ends of the great circle paths plot.
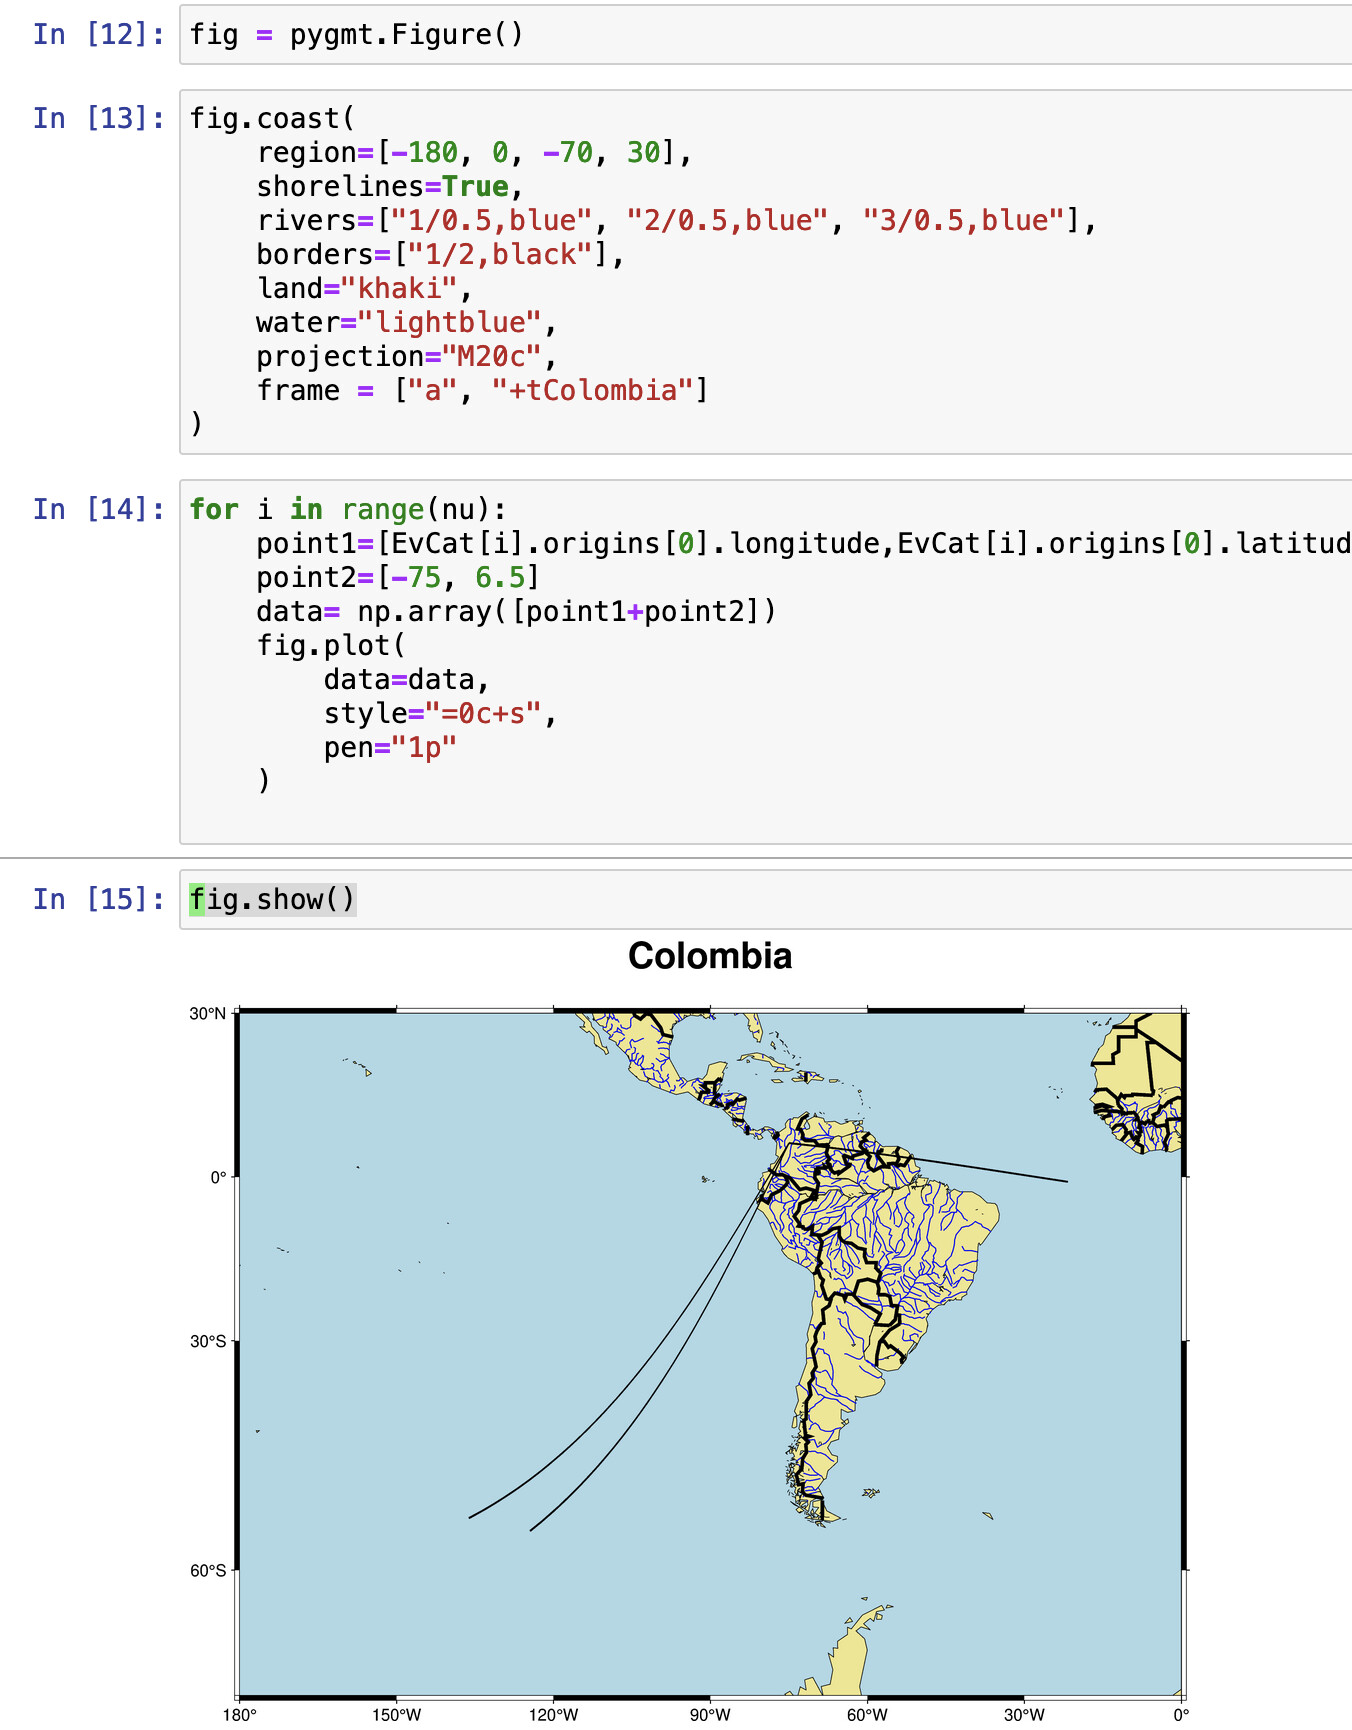
I’ve used data=np.array([point1+point2]) to generate the great circle paths, but when I plot using fig.plot(data=data, style="=0c+s", pen=“1p”) followed of course by fig.show(), the great circle path only appears at all if both the start and end points are included within the min/max lat/lons of the map.
What am I doing wrong? Is there a trick to do this?
Hmm, maybe set up an empty frame first using fig.basemap(region=...)? Could you please post a small code snippet (with coordinates) to show what you’ve tried so far. It’s a little hard to help with abstract variables Oh, and I’m assuming you’ve had a look at https://www.pygmt.org/v0.7.0/tutorials/advanced/vectors.html#plot-geographic-vectors?
Thanks for having a look at this. Hope these screenshots help to describe the problem. It’s the same data set, once plotted so that all endpoints are within the map, once so that only one endpoint is within the map.
Hmm, if I undestand correctly, you want a ‘zoomed in’ map, so your fig.coast's bounding box region should be smaller. I.e. instead of using region=[-120, 0, -70, 30], it should be more like region=[-80, -70, 5, 15] or something.
So, in the top plot, the bounds are [-180, 0, -70, 30] and you can see two gcp lines coming in from the west, and one coming in from the east.
In the second plot, the only change is that the bounding box is reduced to [-120,0,-70,30]. You’ll notice that here, the two rays from the west are now missing. The one from the east, where both ends of the line are within the bounding box, still shows up.
Could you post the output of print(point1) in the for loop? Just want to see what coordinates they are. Oh, and if you can copy and paste the text instead of taking a screenshot, that would save some time too.
 Oh, and I’m assuming you’ve had a look at