Plotting Landsat 8 satellite imagery using GMT's grdimage

I am having a hard time plotting GeoTIFF files that I have downloaded using EarthExplorer (http://earthexplorer.usgs.gov) using grdimage.

I have done the following in QGIS to the original data files:

  • Merged the red, green and blue channels
  • Transformed from the original UTM coordinate system to WGS84.
  • Cut out a selection of interest

Gdalinfo gives:

Driver: GTiff/GeoTIFF
Files: level1_merge_qgis_latlon_cut.tif
Size is 2782, 835
Coordinate System is:
GEOGCRS["WGS 84",
    DATUM["World Geodetic System 1984",
        ELLIPSOID["WGS 84",6378137,298.257223563,
            LENGTHUNIT["metre",1]]],
    PRIMEM["Greenwich",0,
        ANGLEUNIT["degree",0.0174532925199433]],
    CS[ellipsoidal,2],
        AXIS["geodetic latitude (Lat)",north,
            ORDER[1],
            ANGLEUNIT["degree",0.0174532925199433]],
        AXIS["geodetic longitude (Lon)",east,
            ORDER[2],
            ANGLEUNIT["degree",0.0174532925199433]],
    ID["EPSG",4326]]
Data axis to CRS axis mapping: 2,1
Origin = (-71.000000000000000,77.750000000000000)
Pixel Size = (0.000898634076204,-0.000898203592814)
Metadata:
  AREA_OR_POINT=Area
Image Structure Metadata:
  INTERLEAVE=PIXEL
Corner Coordinates:
Upper Left  ( -71.0000000,  77.7500000) ( 71d 0' 0.00"W, 77d45' 0.00"N)
Lower Left  ( -71.0000000,  77.0000000) ( 71d 0' 0.00"W, 77d 0' 0.00"N)
Upper Right ( -68.5000000,  77.7500000) ( 68d30' 0.00"W, 77d45' 0.00"N)
Lower Right ( -68.5000000,  77.0000000) ( 68d30' 0.00"W, 77d 0' 0.00"N)
Center      ( -69.7500000,  77.3750000) ( 69d45' 0.00"W, 77d22'30.00"N)
Band 1 Block=2782x1 Type=Float32, ColorInterp=Gray
Band 2 Block=2782x1 Type=Float32, ColorInterp=Undefined
Band 3 Block=2782x1 Type=Float32, ColorInterp=Undefined

Plotting using

gmt grdimage level1_merge_qgis_latlon_cut.tif -JM5 -Ba -png map

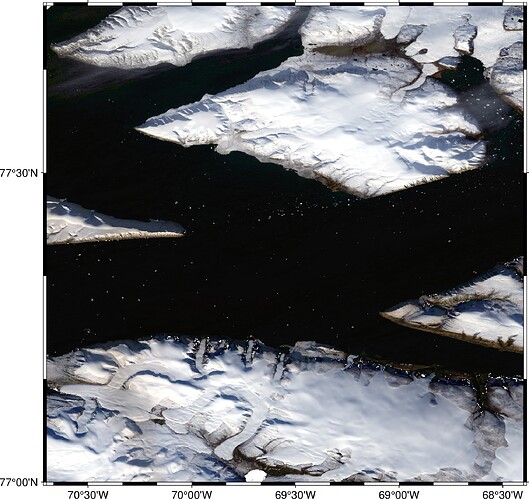
yields the following map:

However, the figure should look like this (screenshot QGIS):
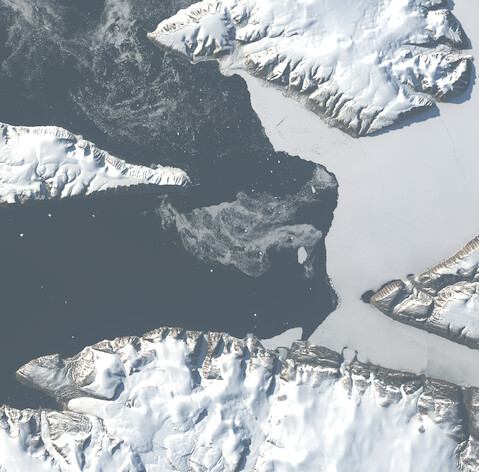
Screenshot 2021-11-03 at 16.59.14

What should I do to get the colors right?

p.s.:
I have seen something about adding +b2,1,0 to the tiff file, but that gives:

grdimage [ERROR]: Using this data type (Float32) is not implemented

Converting with gdal_translate to output type “Byte” and subsequent plotting using grdimage gives me an empty map unfortunately…

Datafile: https://surfdrive.surf.nl/files/index.php/s/lIu6oLc4f3otS5L
Hi,

The case is a bit more complicated that it seems. Satellite images are now in int16 variables but they were acquired with 12-14 bits sensors. That means many of the uint16 DigitalNumbers are empty and one must do contrast stretches to see enhance the data content.

GMT Julia wrappers have tools to deal with this. See

https://www.generic-mapping-tools.org/GMT.jl/dev/gallery/Landsat8/histogram_stretch/
https://www.generic-mapping-tools.org/RemoteS.jl/dev/gallery/L8cube_img/remotes_L8_cube_img/

A very quick shot with Mirone, shows that doing the contrast stretch is what is needed

As Joaquim mentioned, you would need to apply stretching and clipping which QGIS usually does by default. Here’s a script that goes from Landsat8 data downloaded directly from earth explorer to a gmt plot, which could be modified to work with preprocessed data:

#!/bin/bash

R="-70.7/-68.4/77/77.77"

red="LC08_L2SP_032005_20210909_20210916_02_T1_SR_B4"
green="LC08_L2SP_032005_20210909_20210916_02_T1_SR_B3"
blue="LC08_L2SP_032005_20210909_20210916_02_T1_SR_B2"

function normalize_grid {
    # Normalize values to 0-1
    input=$1
    output=$2
    range=`gmt grdinfo ${input} -T`
    normmin=`echo $range | awk -F "[T/]" '{print $2}'`
    max=`echo $range | awk -F "[T/]" '{print $3}'`
    normmax="$((${max}-${normmin}))"
    # Normalize from 0-1
    gmt grdmath ${input} ${normmin} SUB ${normmax} DIV -V = ${output}
}

function clip_grid {
    # Clip grid values to 2-98%
    input=$1
    output=$2
    cliprange=`gmt grdinfo ${input} -T+a2`
    clipmin=`echo $cliprange | awk -F "[T/]" '{print $2}'`
    clipmax=`echo $cliprange | awk -F "[T/]" '{print $3}'`
    gmt grdclip ${input} -G${output} -Sb${clipmin}/${clipmin} -Sa${clipmax}/${clipmax} -V
}

function process_band {
    # Process band from GeoTiff image for use in grdmix, by converting all 0
    # values to NAN, clipping the tails of the distribution using an alpha value of 2,
    # and normalizing 0-1.
    # Expects:
    # - Prefix for input GeoTiff image file.
    # - Band number with 0 indexing (i.e., one less than typical band naming conventions) in format "b1".
    # Returns:
    # Filename for the processed netcdf file.
    #
    # Set variables for file names
    prefix=$1
    band=$2
    input="${prefix}.TIF=gd+${band}"
    output0="${prefix}_${band}_int.nc"
    output1="${prefix}_${band}_clip.nc"
    output2="${prefix}_${band}_clip_norm.nc"
    # Convert 0 to NaN
    gmt grdmath ${input} 0 NAN = "${output0}=nf"
    # Clip to 2 and 98 percentiles
    clip_grid ${output0} ${output1}
    # Normalize values to 0-1
    normalize_grid ${output1} ${output2}
    echo ${output2}
}

gdalwarp -t_srs EPSG:4326 -r near -of GTIFF "${red}.TIF" "${red}_proj.TIF"
gdalwarp -t_srs EPSG:4326 -r near -of GTIFF "${blue}.TIF" "${blue}_proj.TIF"
gdalwarp -t_srs EPSG:4326 -r near -of GTIFF "${green}.TIF" "${green}_proj.TIF"


red_file=`process_band "${red}_proj" "b0"`
green_file=`process_band "${green}_proj" "b0"`
blue_file=`process_band "${blue}_proj" "b0"`

gmt grdmix ${red_file} ${green_file} ${blue_file} -Gimage.tif -C

gmt grdimage image.tif=gd -Q -R${R} -V -B -jpg landsat8

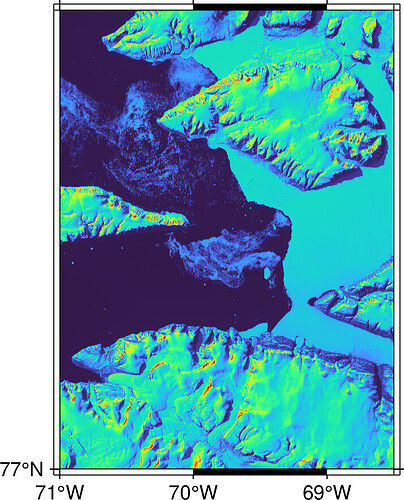
With the result:

2 Likes

Thanks @Joaquim! I tried to compile GMTjl using Conda, but then got the libgdal error (which was reported on GitHub already (https://github.com/GenericMappingTools/GMT.jl/issues/627)

GMTjl looks very neat! I will definitely try it when the compilation errors have been resolved. I am trying not to combine brew and conda too much.

Fantastic, thanks @meghanj!! You made my day! :clap:

Ghrr, as I said in that issue I can’t understand how that can happen. When a GMT brew installation exists

readlines(`gmt --version`)[1]

prints the GMT version (it does for you, doesn’t it?) and does not try to reinstall GMT via conda.

Can you try to remove the GMT-conda. Apparently that worked for the other user.

import Conda
Conda.rm("gmt")

Restart Julia and try again using GMT

1 Like
For those who are interested in exploring Landsat 8 imagery without the need for scripting, I would recommend checking out EOS LandViewer https://eos.com/products/landviewer/ Because I already have experience with it. This web-based platform allows users to search, preview, and download Landsat 8 imagery in a user-friendly interface. It also includes built-in tools for image processing and analysis, making it a great option.