Thanks for your help and its awesome. I will try it to be familiar with this.
The error or warning message of ogr2ogr is;
Warning 1: The output driver does not seem to natively support Integer64 type for field ID_0.
Converting it to Real instead. -mapFieldType can be used to control field type conversion.
Showing this warning, but it can do the work, so probably there is no problem with this warning.
To be fair, I have to mention that I have little experience working with ogr2ogr. I normally read shp files into a geopandas.Dataframe (also done here). Then it is quite easy to explore the data regarding the names and data types of the different columns:
import geopandas as gpd

shp_file = "JPN_adm1.shp"
areas = gpd.read_file(shp_file)
areas.columns
# areas.ID_1
Thanks. I think these orgr2ogr warning not causing major problem and the task is done.
Apart from this, there is a query related to same area, I am plotting the same location area. Purpose is to plot only the Japan without surrounding areas. The code and figure are;
There is a query related to above post, maybe you have an idea about it.
If user have some parameter data available in global shape data set, is it possible to get particular country shape data from this whole global data set?
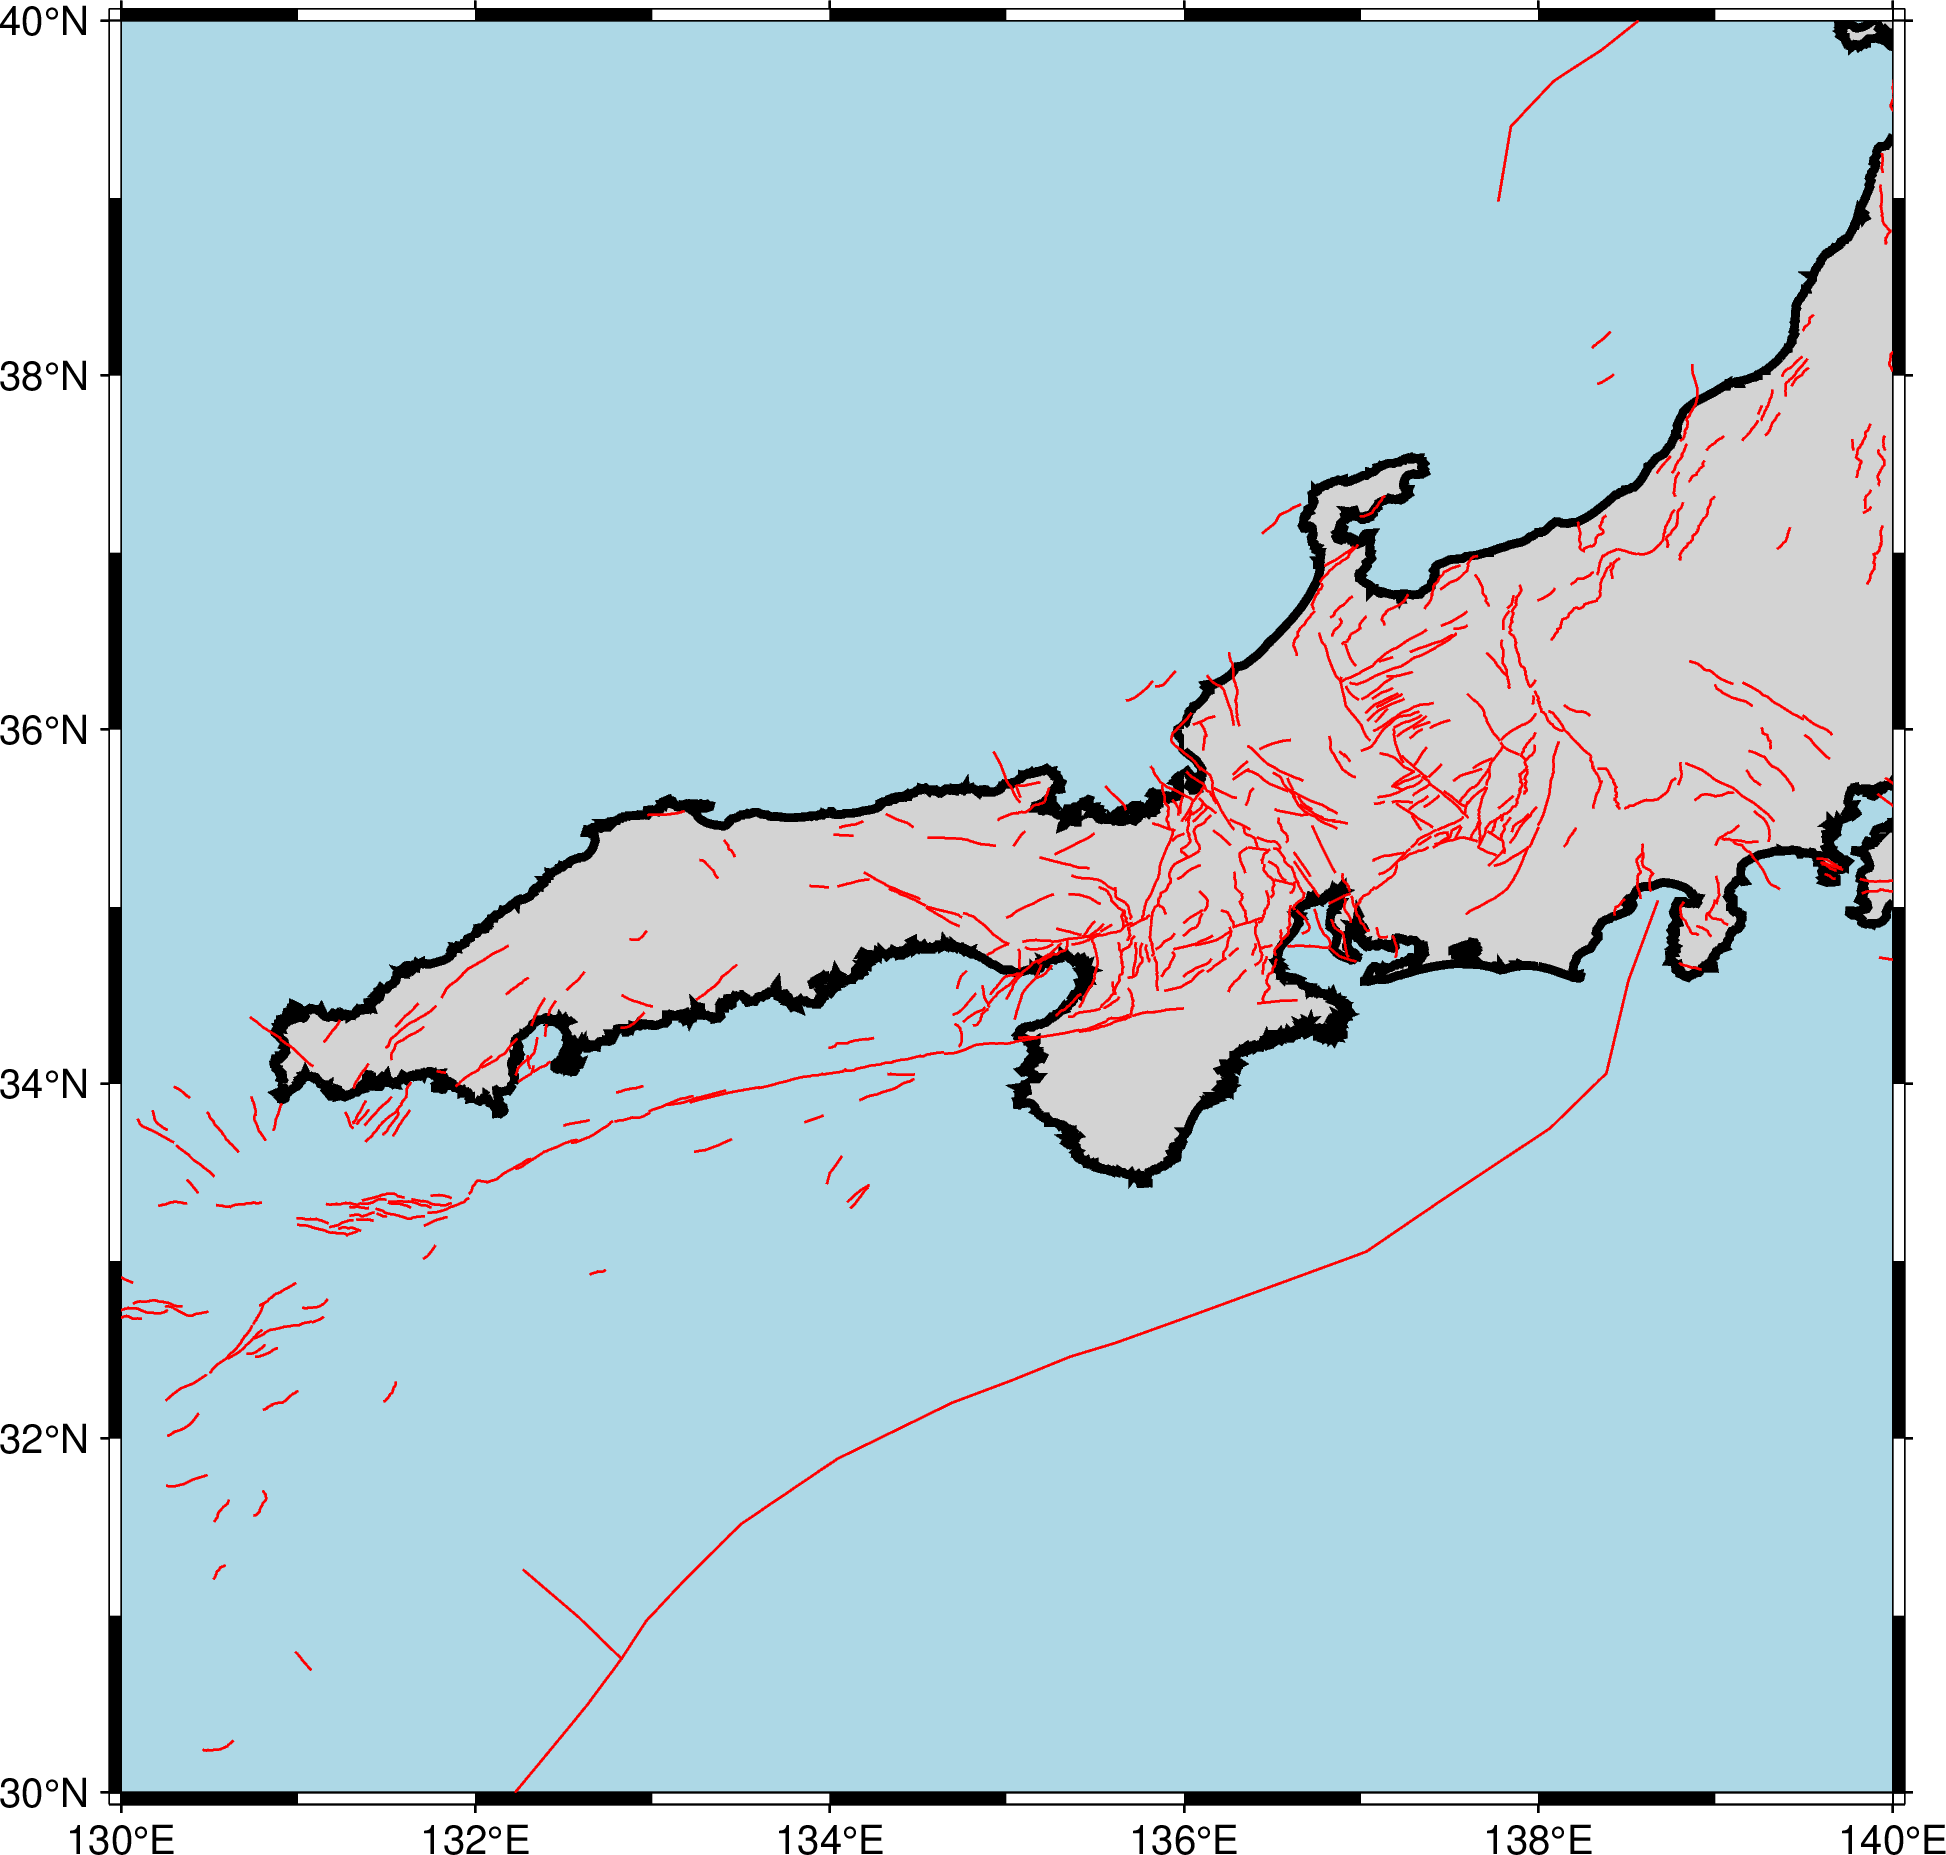
Purpose to extract country specific parameter data from global data of that parameter, the global data in shape format. e.g. below is global plates data. I want to extract plate details which passess through specific region e.g. Japan from global plate data.
Still not clear what you want. What specific country plate data? The plate(s) at which a country belongs?
BTW, your zip file is incomplete. A shape file is set of files, not only the .shp
Anyway, my general advise to these type of operations within the GMT family is, use GMT.jl. It has handy OGR formats reading, wrappers to GEOS functions (in case you need to do polygon intersections), etc.
Plots grayshaded, colored, or textured land-masses [or water-masses] on maps and [optionally] draws coastlines, rivers, and political boundaries. Alternatively, it can (1) issue clip paths that will contain all land or all water areas, …
And when will we stop adding administrative borders? When the DCW has 1GB? All countries have administrative borders, and of several orders. I’ve said that before. IMO it’s not a GMT role to provide this type of data.
The data are freely available for academic use and other non-commercial use. Redistribution, or commercial use is not allowed without prior permission. See the license for more details.
We would have to seek prior permission, before spending any effort on it. But, there is no permission needed for us to write a gad-gmt repo that takes their data set and builds a gmt DCW-like compressed nc file and then GMT users could build their own gmt-compatible gadm dataset, i.e., no redistribution. We may have to do the same regarding GSHHG3 that basically builds from an OSM dataset.