Plotting specific part of a geographic area

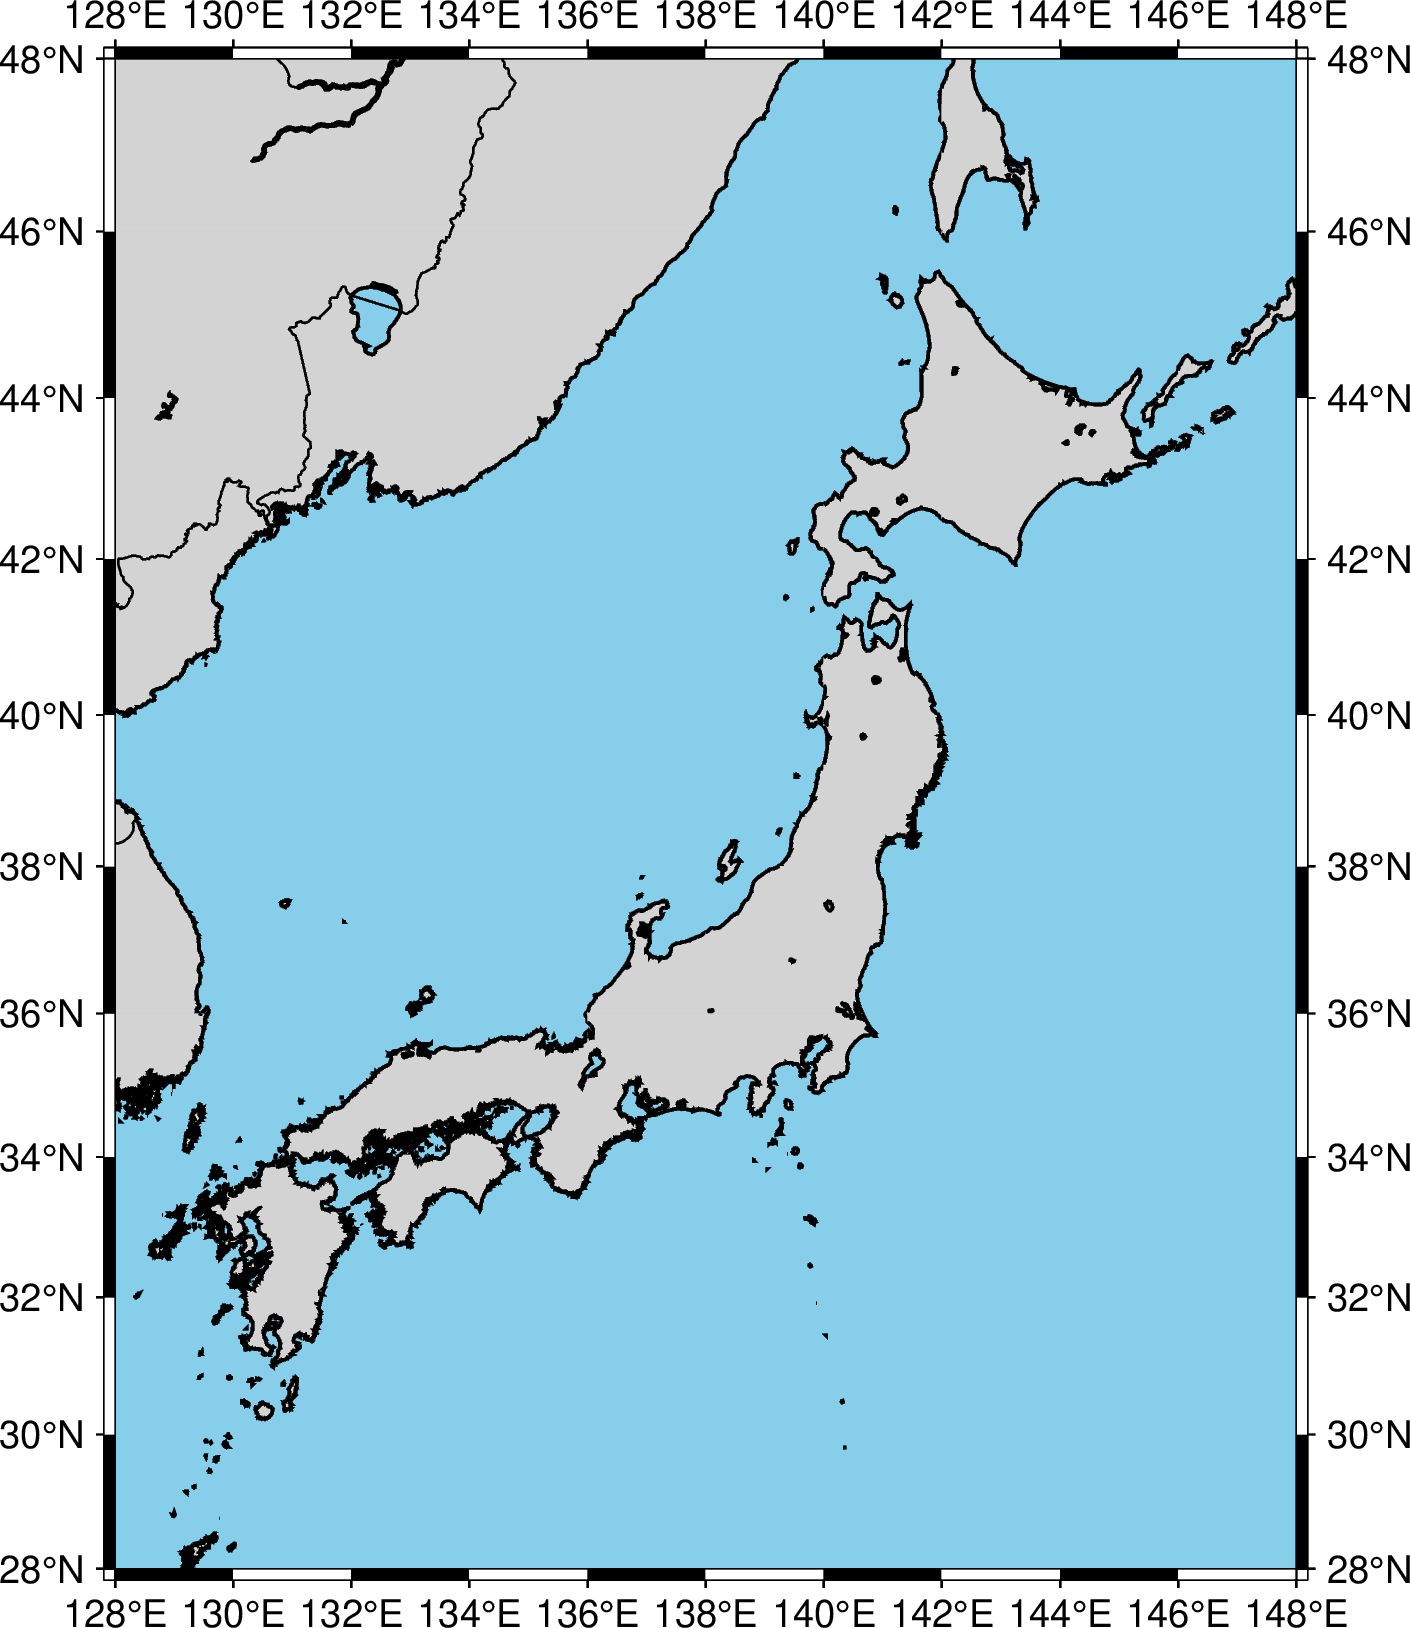
I am trying to plot a geographic area, the area comprised of multiple regions. To understand, I tested this by plotting below geographic area, it is easy to plot this country map using GMT as attached in figure 1.

Figure 1.

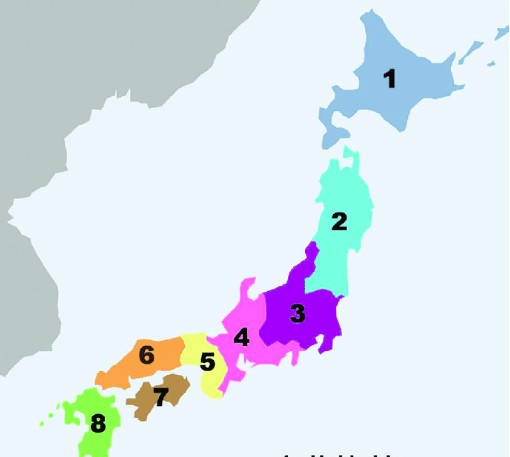
What I want to achieve is shown in below reference figure 2.

Figure 2.
Map

Queries are;

  1. Whether it is possible to plot and show individual boundaries of each region (1-8) in figure 1 (which is plotted using GMT)? So each region is recognizable individually.

  2. Whether it is possible to plot individual regions without other regions in figure 1 using GMT?

Any help will be appreciated. Thanks

GMT does not know about those regions so you will need to

  1. Get polygons for all your regions, probably from Japan’s official science institutes.
  2. Plot them with gmt plot as filled polygons

I have downloaded data which may contain administrative regions of this country, the following image shows which formats (.cpg, .csv, .shp …) of data listed in downloaded data.

Selection_035

I tried with (.shp) data to plot the regions using GMT, but not successful. Can you provide an idea which format of this listed data can be used and which commands can help to do this? Thanks.

GTM should be able to handle csv and shp.

What did you try?

I am not sure how to use shp format properly, but I have follow the way as available on;

(Plot shapefiles in X-Y coordinates)

But it does not work, can you explain which way can be used to plot with shp data exactly? Thanks.

You can use directly with something like this:

gmt plot JPN_adm2.shp -W -Baf -png Test

Followed your commands, the following error appear in terminal.

It seems like a bug or maybe the shp is corrupted. What GMT version are you using?

Alternatively you could try with the csv file.

The problem is that a shape file is the set of all those files that it is complaining of missing. You need to have them all sit near by the .shp file. But I doubt that file will reproduce the figure you shown in first post. It will very likely be similar to (this is using the GMT.jl Julia wrapper)
And painting the polygons is another story.

using GMT

japan = gadm("JPN", children=true);
viz(japan, proj=:guess, title="States of Japan")

@Esteban82 & @Joaquim

I am using GMT-6.4.0. Yes, data have shp file with other files of (cpg, csv, prj, dbp) formats.

Data is downloaded from this site (https://www.diva-gis.org/Data) for Japan area, as it is higher in size so not uploading here.

May be there is some error in shp file, but am not sure about it.

See if gdal handles it:

$ ogr2ogr -f GMT <out file> <in file>

This is what gmt calls behind the curtains.

That’s the exactly part where the error occurred. See the screen capture (We advise against screen captures).

Try using the master version of GMT.

I manage to make the map from data of the link.

gmt plot JPN_adm1.shp -W0,red -Baf -png Japan

The error comes from ogr2ogr, not from GMT.

Note that the ogr2ogr command in the screen capture does ‘-f OGR_GMT’. Isn’t ‘-f GMT’ the correct one? We discusssed this before (couple of years ago). I always use ‘-f GMT’. I wonder why that works then.

Guess it’s right:

$ ogrinfo --formats | grep -i gmt
  OGR_GMT -vector- (rw+v): GMT ASCII Vectors (.gmt)

I think we had a discussion at one time regarding -f GMT vs. -f OGR_GMT. But maybe not relevant for this issue.

There used to exist a GMT raster driver and I guess that clarity the OGR_GMT name was created.

May be. All I know is I’m still using ‘-F GMT’, and that works fine with vector data.

Thanks to everyone for their help. The conclusion for this may be;

  1. User can plot the shp file directly using gmt plot, it will do the task.

  2. gdal handles it with following commands.

$ ogr2ogr -f GMT out_file input_file   or
$ ogr2ogr -f OGR_GMT out_file input_file

But may be the ogr2ogr give some errors in terminal output but it will do the task.

  1. To fill the color for whole shp plot, gmt plot with (G) can do the task.

  2. To color all the polygons with different colors, I followed this procedure (Coloring OGR_GMT polygon files based on attribute column), but it give errors.

Is there an easy way to differently color all the polygons for above map using GMT?

  1. To color all the polygons with different colors, I followed this procedure (Coloring OGR_GMT polygon files based on attribute column ), but it give errors.

Can you please post your error message?

Hm, looking at the column names of the shape file here, there is no column named zattribute or attribute:

Index(['ID_0', 'ISO', 'NAME_0', 'ID_1', 'NAME_1', 'TYPE_1', 'ENGTYPE_1',
       'NL_NAME_1', 'VARNAME_1', 'geometry'], dtype='object')

But here, you can use the column ID_1 to color each polygon (there are 47 in this shape file) with a specific color:

gmt makecpt -Cbatlow -T1/47/1 > batlow_resampled.cpt
gmt plot JPN_adm1.shp -Baf -W0.1p,black -Cbatlow_resampled.cpt -L -G+z -aZ=ID_1 -png japan_map

Output figure