Hi all,
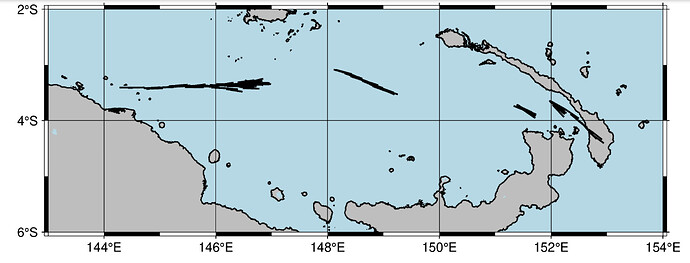
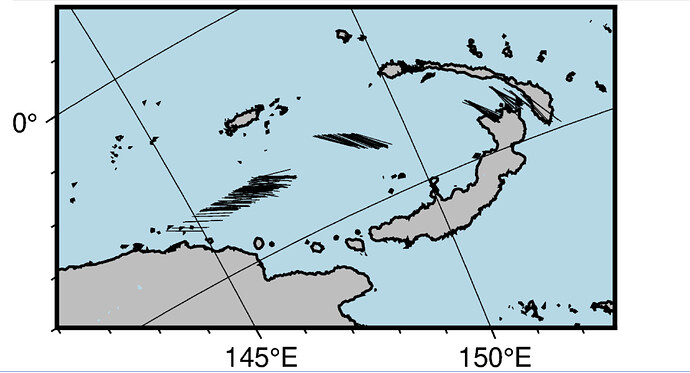
I am plotting a map using an oblique mercator projection. I’d like to add vectors with earthquake latitude, longitude, and nodal plane strike. However, when I plot these as vectors on top of the map, they don’t plot in the oblique mercator projection of the basemap—they plot using the cartesian coordinates of the figure, so the azimuths are wrong. Here is a photo of the comparison between the same azimuths plotted on the two projections. The earthquakes should strike roughly E-W the entire western segment, so they should not also be striking that same direction in the oblique mercator map. This is even after I specify the projection when plotting these vectors.
See code:
fig = pygmt.Figure()
fig.coast(projection="OC147/-3/-10.7/145.7/6c", region="141/-4.0/155/-3.0+r",
    frame="afg",
    land="gray",
    shorelines="1/thin",
   water="lightblue",
)

fig.plot(region="141/-4.0/155/-3.0+r",
    projection="OC147/-3/-10.7/145.7/6c",
    data=vectors,
    style="v0c",
    pen="0.1p",
)
fig.show(width=1000, dpi=400)

#vectors are in format [latitude, longitude, azimuth, length]


