Yes, it’s also possible to use the azimuth and length of geographic vectors for plotting. But please note, that the length is the geographic length (by default in kilometers).
import pygmt as gmt
import numpy as np
lons = [-80, -60, 0, -40, -20]
lats = [0] * len(lons)
vector_dirs = [0, 10, 20, 30, 40]
vector_lens = np.array([1, 2, 3, 4, 5]) *1000
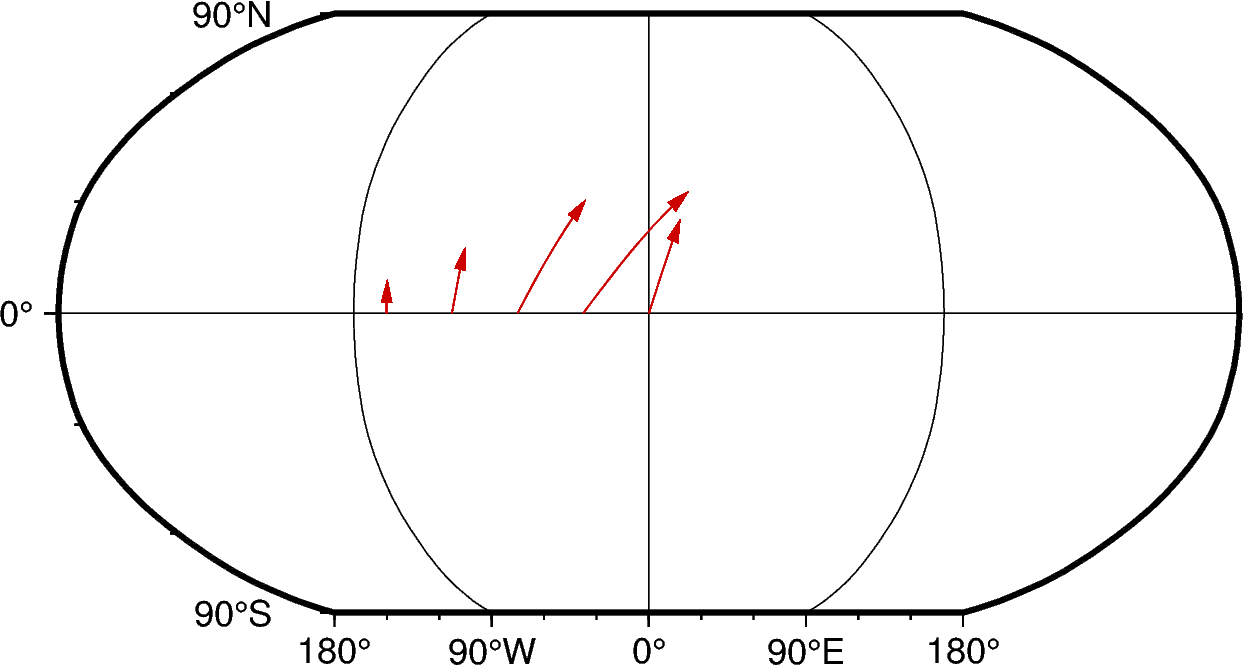
# lon_degE, lat_degN, dir_cw_from_N, len_km
vectors = [
[-80, 0, 0, 1000],
[-60, 0, 10, 2000],
[ 0, 0, 20, 3000],
[-40, 0, 30, 4000],
[-20, 0, 40, 5000],
]
fig = gmt.Figure()
fig.plot(
region="d",
projection="N10c",
frame="afg",
data=vectors,
style="=0.2c+e+h0.1c",
pen="0.3p,red3",
fill="red3",
)
fig.show()