Por quality of background image with tilemap

Hi folks,

I’m using tilemaps to generate the background image for my plot. Unfortunately, no matter the zoom level I use (10,14 or ‘auto’) the image is never sharp. How to solve this?

Code to reproduce:

LON_LIM = [9.15,9.36]
LAT_LIM = [40.51,40.71]

fig = pygmt.Figure()
fig.tilemap(region = LON_LIM+LAT_LIM,
            projection = "M4i",
            zoom = 'auto',
            source = contextily.providers.OpenStreetMap.Mapnik,
            frame = True,
            dpi = 300
            )

Thanks in advance!

Gio

Hi @19giovi87, thanks for trying out the new tilemap feature in PyGMT v0.10.0!

There are a few reasons the background OpenStreetMap image you used isn’t sharp. The main reason is that OpenStreetMap XYZ tiles are served in a Spherical Mercator (EPSG:3857) format, but are reprojected to geographic lon/lat coordinates (OGC:CRS84), so the text labels can appear distorted or not sharp.

Here are a few suggestions that could help:

  • Set the projection to a higher value, e.g. M6i to get a 6 inch map.
  • Use an alternative tile provider from the list at A full look into providers objects - xyzservices 2023.10.1, or a custom one. There may be one that serves tilemaps in EPSG:4326/OGC:CRS84, though they are not common.
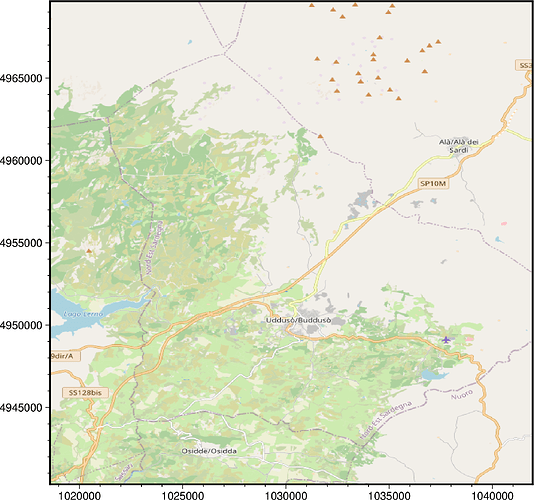
  • Use native EPSG:3857 coordinates (same as the tilemap) instead of longitude/latitude for the region, and set lonlat=False. Something like this:
# https://epsg.io/transform
X_LIM = [1018573.3407584531, 1041950.4338250406]
Y_LIM = [4940333.233068203, 4969660.375061779]

fig = pygmt.Figure()
fig.tilemap(
    region=X_LIM + Y_LIM,
    # projection="X10c",
    zoom="auto",
    source=contextily.providers.OpenStreetMap.Mapnik,
    lonlat=False,
    frame=True,
)
fig.savefig("map.png")

produces

Of course, you would then need to reproject any data you overlap on the map to EPSG:3857. Will leave it up to you on what projection system is best for your work. Good luck!

1 Like

Great @weiji14! thanks a lot

Hi, is there an equivalent of this in CLI gmt?

So far I know, this is unfortuanately not the case.

Thanks! I suspected that.

BTW this square map is actually horizontally distorted

to get undistorted one need to specify projection="x1:150000", otherwise pygmt produces a square map using Cartesian X projection (unlike M projection that keeps correct proportions):

X_LIM = [1018573.3407584531, 1041950.4338250406]
Y_LIM = [4940333.233068203, 4969660.375061779]

fig = pygmt.Figure()
fig.tilemap(
    region=X_LIM + Y_LIM,
    # projection="X10c",
    projection="x1:150000",
    zoom="auto",
    source=contextily.providers.OpenStreetMap.Mapnik,
    lonlat=False,
    frame=True,
)
fig.savefig("map.png",show=True)

result

Also, when using native EPSG:3857 ccordinates, I get a very small but a distinct mismatch between my grid and coastline data reprojected into EPSG:3857 with the pygmt’s tilemap in native EPSG:3875 coordinates. While if I use M projection for producing tilemap with pygmt and geographical grid and coastline, the match is perfect (but tilemap is ugly).

Is it possible to save the resulting tilemap as geotiff retaining the geographical information, the way grdimage does via -A option? If not, can this be implemented? It seems fig.tilemap calls grdimage under the hood anyway?

Yes, use pygmt.datasets.load_tile_map, where you can get the underlying RGB xarray.DataArray raster object. You can then save this to a GeoTIFF via rioxarray Example - Convert dataset to raster (GeoTiff) — rioxarray 0.15.1 documentation

You can also look at Reference Guide — contextily 1.1.0 documentation, which is what that load_tile_map function is using behind the scenes.

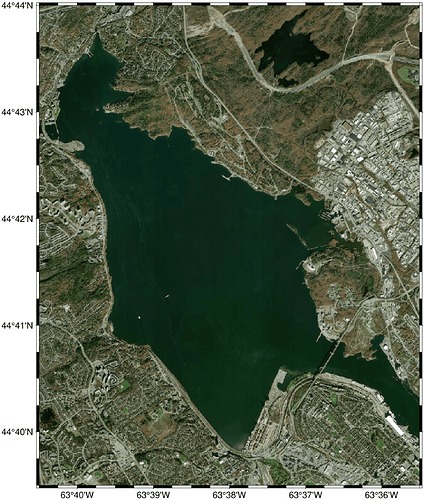
Once the tile map is created, is there a way to have the x- and y-tick labels back in lat/lon? That would help a lot!

I tried the idea below, it kind of works but it is semi-manual and I don’t understand the problem.

The idea is to overlay a projected basemap on top of the EPSG:3857 tilemap, like in gmt example 28 (28) Mixing UTM and geographic data sets — GMT 6.5.0 documentation and http://docs.generic-mapping-tools.org/4.5/gmt/html/GMT_Docs.html#x1-1630007.28

There are two problems that I had to solve manually. Problem 1 is that the region of interest is adjusted automatically by fig.tilemap(). I had to copy the adjusted coordinates from the debug output on the Python console, paste and and re-run the code below.

Problem 2 is that the projected basemap is plotted with a huge vertical offset. This offset needs to be compensated for manually so that the projected basemap is overlaid perfectly over the tilemap. I asked about this in https://flint.soest.hawaii.edu/t/overlaying-geographical-data-over-projected-cartesian-data-utm-works-web-mercator-doesnt-epsg-3057-doesnt/4358 but got no comments.

Anyway, below is the pygmt code for my ROI and the resulting map.

Would be very grateful for suggestions on how to eliminate manual coordinate and offset adjustments.

import pygmt
import pyproj

transformer = pyproj.Transformer.from_crs('epsg:4326', 'epsg:3857', always_xy=True)
transformer_reversed = pyproj.Transformer.from_crs('epsg:3857', 'epsg:4326', always_xy=True)

##E=-63-35.5/60.0
##W=-63-40.5/60.0
##S=44+39.5/60.0
##N=44+44.0/60.0
##
##LL_X,LL_Y = transformer.transform(W,S)
##UR_X,UR_Y = transformer.transform(E,N)

### the following values were taken from grdimage debug output when using the above
### reported adjustments were relatively large for W and S
##grdimage [WARNING]: (w - x_min) must equal (NX + eps) * x_inc), where NX is an integer and |eps| <= 0.0001.
##grdimage [WARNING]: w reset from -7088268.57626 to -7088277.75767
##grdimage [WARNING]: (e - x_min) must equal (NX + eps) * x_inc), where NX is an integer and |eps| <= 0.0001.
##grdimage [WARNING]: e reset from -7078991.95203 to -7078991.1444
##grdimage [WARNING]: (s - y_min) must equal (NY + eps) * y_inc), where NY is an integer and |eps| <= 0.0001.
##grdimage [WARNING]: s reset from 5567892.48683 to 5567888.65785
##grdimage [WARNING]: (n - y_min) must equal (NY + eps) * y_inc), where NY is an integer and |eps| <= 0.0001.
##grdimage [WARNING]: n reset from 5579637.51917 to 5579638.94625
LL_X=-7088277.75767
LL_Y=5567888.65785
UR_X=-7078991.1444
UR_Y=5579638.94625

W,S = transformer_reversed.transform(LL_X,LL_Y)
E,N = transformer_reversed.transform(UR_X,UR_Y)

print("W,S = %g,%g" % (W,S))
print("E,N = %g,%g" % (E,N))

#quit() # debug

fig = pygmt.Figure()
fig.tilemap(
    #region=[W, E, S, N],
    region=[LL_X, UR_X, LL_Y, UR_Y],
    lonlat=False,
    projection="x1:50000",
    # Set level of details (0-22)
    # Please note, not all zoom levels are always available
    zoom="auto",
    # Use tiles from OpenStreetMap tile server
    source="https://{s}.tile.openstreetmap.org/{z}/{x}/{y}.png",
    frame=["WSne", "x2000","y2000"]
)

pygmt.config(
    MAP_FRAME_TYPE="plain",
    MAP_FRAME_PEN="auto,red",
    MAP_TICK_PEN_PRIMARY="auto,red",
    MAP_GRID_PEN_PRIMARY="auto,red"
)
# the following vertical offset (yshift="-2.5569h") was selected manually
# probably has something to do with handling web mercator in gmt
# projecting epsg:3857 onto the gmt plot plane produces an Y offset?
fig.shift_origin(yshift="-2.5569h")
fig.basemap( region=[W, E, S, N],
             projection="epsg:3857/1:50000",
             frame=["NEws","x1m","y1m"]
             )

fig.savefig("test_pygmt_tilemap_python.png",show=True)
I also don’t understand the Y axis scale. 1 minute of latitude should be ~1852 m (1 nautical mile). From the produced plot above it appears that 1 min of latitude is greater than 2000 meters, see for example red ticks for 44d41’and 44d42’ and two black Cartesian ticks in between, 5572000 and 5574000 meters.

the frame issues have been solved, thanks to @Joaquim, details in https://flint.soest.hawaii.edu/t/overlaying-geographical-data-over-projected-cartesian-data-utm-works-web-mercator-doesnt-epsg-3057-doesnt/4358/16
the key was to explicitly specify ellipsoid when drawing the map frame separately.

import pygmt
import pyproj

transformer = pyproj.Transformer.from_crs('epsg:4326', 'epsg:3857', always_xy=True)
#transformer_reversed = pyproj.Transformer.from_crs('epsg:3857', 'epsg:4326', always_xy=True)

E=-63-35.5/60.0
W=-63-40.5/60.0
S=44+39.5/60.0
N=44+44.0/60.0

LL_X,LL_Y = transformer.transform(W,S)
UR_X,UR_Y = transformer.transform(E,N)

print("W,S = %g,%g" % (W,S))
print("E,N = %g,%g" % (E,N))

fig = pygmt.Figure()
fig.tilemap(
    #region=[W, E, S, N],
    region=[LL_X, UR_X, LL_Y, UR_Y],
    lonlat=False,
    projection="x1:50000",
    # Set level of details (0-22)
    # Please note, not all zoom levels are always available
    zoom="auto",
    # Use tiles from OpenStreetMap tile server
    source="https://{s}.tile.openstreetmap.org/{z}/{x}/{y}.png",
    #frame=["WS", "x2000","y2000"]
)

pygmt.config(
    MAP_FRAME_TYPE="plain",
    PROJ_ELLIPSOID="6378137"
)
fig.basemap( region=[W, E, S, N],
             projection="m1:50000",
             frame=["WSne", "x1m", "y1m" ]
             )

fig.savefig("test_pygmt_tilemap_python.png",show=True)

Great job! Thanks!

Or …

pip install juliacall

from juliacall import Main as jl

jl.seval("using GMT")

from array import array

lon = array('f', [-63.675, -63.5917])
lat = array('f', [44.6583, 44.733333333])
#I = jl.mosaic(lon, lat, provider="OSM");     # the same as above
I = jl.mosaic(lon, lat);                      # A Bing map
jl.viz(I, proj="merc", dpi=100)               # Use low res to be able to upload it here

Nice! Thanks.

It is of course possible to plot using pygmt’s tilemap() in one step specifying -Jm... as projection like you did, the code is below.

The problem in this case is the raster map gets reprojected cause the source raster is in Web Mercator. After this reprojection all the text labels and small details on the raster map become distorted, ugly and poorly readable. Hence my decision to plot the raster map as it is and try overlaying a reprojected geographical frame (and possibly other geographical data) instead.

fig = pygmt.Figure()
fig.tilemap(
    region=[W, E, S, N],
    lonlat=True,
    projection="m1:50000",
    zoom="auto",
    # Use tiles from OpenStreetMap tile server
    source="https://{s}.tile.openstreetmap.org/{z}/{x}/{y}.png",
    frame=["WSne", "x1m", "y1m" ]
)