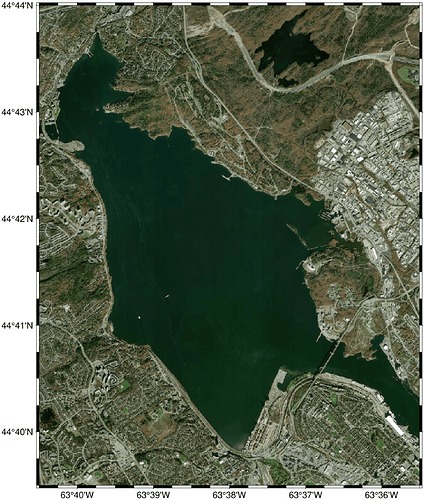
I tried the idea below, it kind of works but it is semi-manual and I don’t understand the problem.
The idea is to overlay a projected basemap
on top of the EPSG:3857 tilemap, like in gmt example 28 (28) Mixing UTM and geographic data sets — GMT 6.5.0 documentation and http://docs.generic-mapping-tools.org/4.5/gmt/html/GMT_Docs.html#x1-1630007.28
There are two problems that I had to solve manually. Problem 1 is that the region of interest is adjusted automatically by fig.tilemap()
. I had to copy the adjusted coordinates from the debug output on the Python console, paste and and re-run the code below.
Problem 2 is that the projected basemap is plotted with a huge vertical offset. This offset needs to be compensated for manually so that the projected basemap is overlaid perfectly over the tilemap. I asked about this in https://flint.soest.hawaii.edu/t/overlaying-geographical-data-over-projected-cartesian-data-utm-works-web-mercator-doesnt-epsg-3057-doesnt/4358 but got no comments.
Anyway, below is the pygmt
code for my ROI and the resulting map.
Would be very grateful for suggestions on how to eliminate manual coordinate and offset adjustments.
import pygmt
import pyproj
transformer = pyproj.Transformer.from_crs('epsg:4326', 'epsg:3857', always_xy=True)
transformer_reversed = pyproj.Transformer.from_crs('epsg:3857', 'epsg:4326', always_xy=True)
##E=-63-35.5/60.0
##W=-63-40.5/60.0
##S=44+39.5/60.0
##N=44+44.0/60.0
##
##LL_X,LL_Y = transformer.transform(W,S)
##UR_X,UR_Y = transformer.transform(E,N)
### the following values were taken from grdimage debug output when using the above
### reported adjustments were relatively large for W and S
##grdimage [WARNING]: (w - x_min) must equal (NX + eps) * x_inc), where NX is an integer and |eps| <= 0.0001.
##grdimage [WARNING]: w reset from -7088268.57626 to -7088277.75767
##grdimage [WARNING]: (e - x_min) must equal (NX + eps) * x_inc), where NX is an integer and |eps| <= 0.0001.
##grdimage [WARNING]: e reset from -7078991.95203 to -7078991.1444
##grdimage [WARNING]: (s - y_min) must equal (NY + eps) * y_inc), where NY is an integer and |eps| <= 0.0001.
##grdimage [WARNING]: s reset from 5567892.48683 to 5567888.65785
##grdimage [WARNING]: (n - y_min) must equal (NY + eps) * y_inc), where NY is an integer and |eps| <= 0.0001.
##grdimage [WARNING]: n reset from 5579637.51917 to 5579638.94625
LL_X=-7088277.75767
LL_Y=5567888.65785
UR_X=-7078991.1444
UR_Y=5579638.94625
W,S = transformer_reversed.transform(LL_X,LL_Y)
E,N = transformer_reversed.transform(UR_X,UR_Y)
print("W,S = %g,%g" % (W,S))
print("E,N = %g,%g" % (E,N))
#quit() # debug
fig = pygmt.Figure()
fig.tilemap(
#region=[W, E, S, N],
region=[LL_X, UR_X, LL_Y, UR_Y],
lonlat=False,
projection="x1:50000",
# Set level of details (0-22)
# Please note, not all zoom levels are always available
zoom="auto",
# Use tiles from OpenStreetMap tile server
source="https://{s}.tile.openstreetmap.org/{z}/{x}/{y}.png",
frame=["WSne", "x2000","y2000"]
)
pygmt.config(
MAP_FRAME_TYPE="plain",
MAP_FRAME_PEN="auto,red",
MAP_TICK_PEN_PRIMARY="auto,red",
MAP_GRID_PEN_PRIMARY="auto,red"
)
# the following vertical offset (yshift="-2.5569h") was selected manually
# probably has something to do with handling web mercator in gmt
# projecting epsg:3857 onto the gmt plot plane produces an Y offset?
fig.shift_origin(yshift="-2.5569h")
fig.basemap( region=[W, E, S, N],
projection="epsg:3857/1:50000",
frame=["NEws","x1m","y1m"]
)
fig.savefig("test_pygmt_tilemap_python.png",show=True)