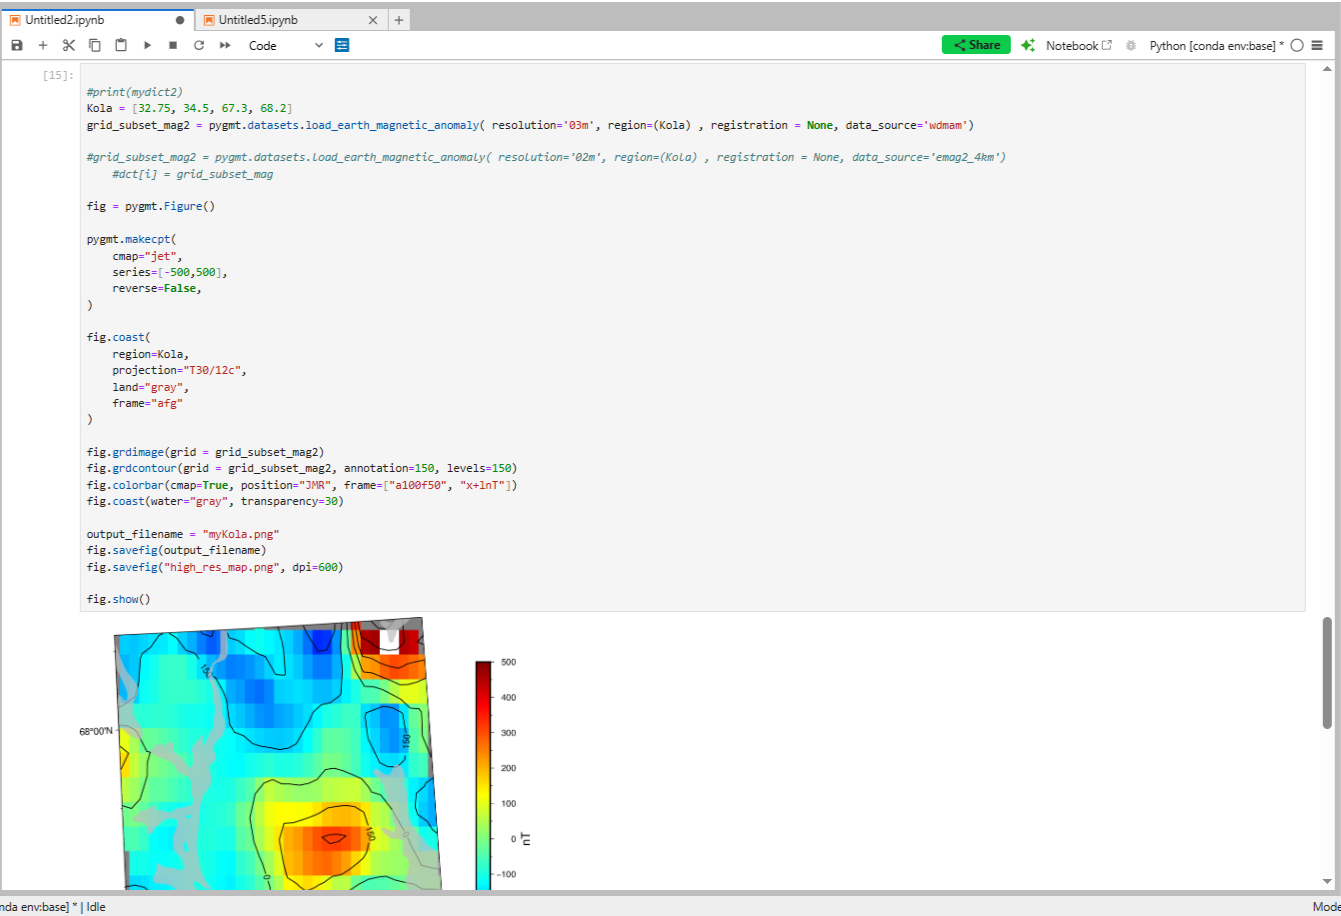
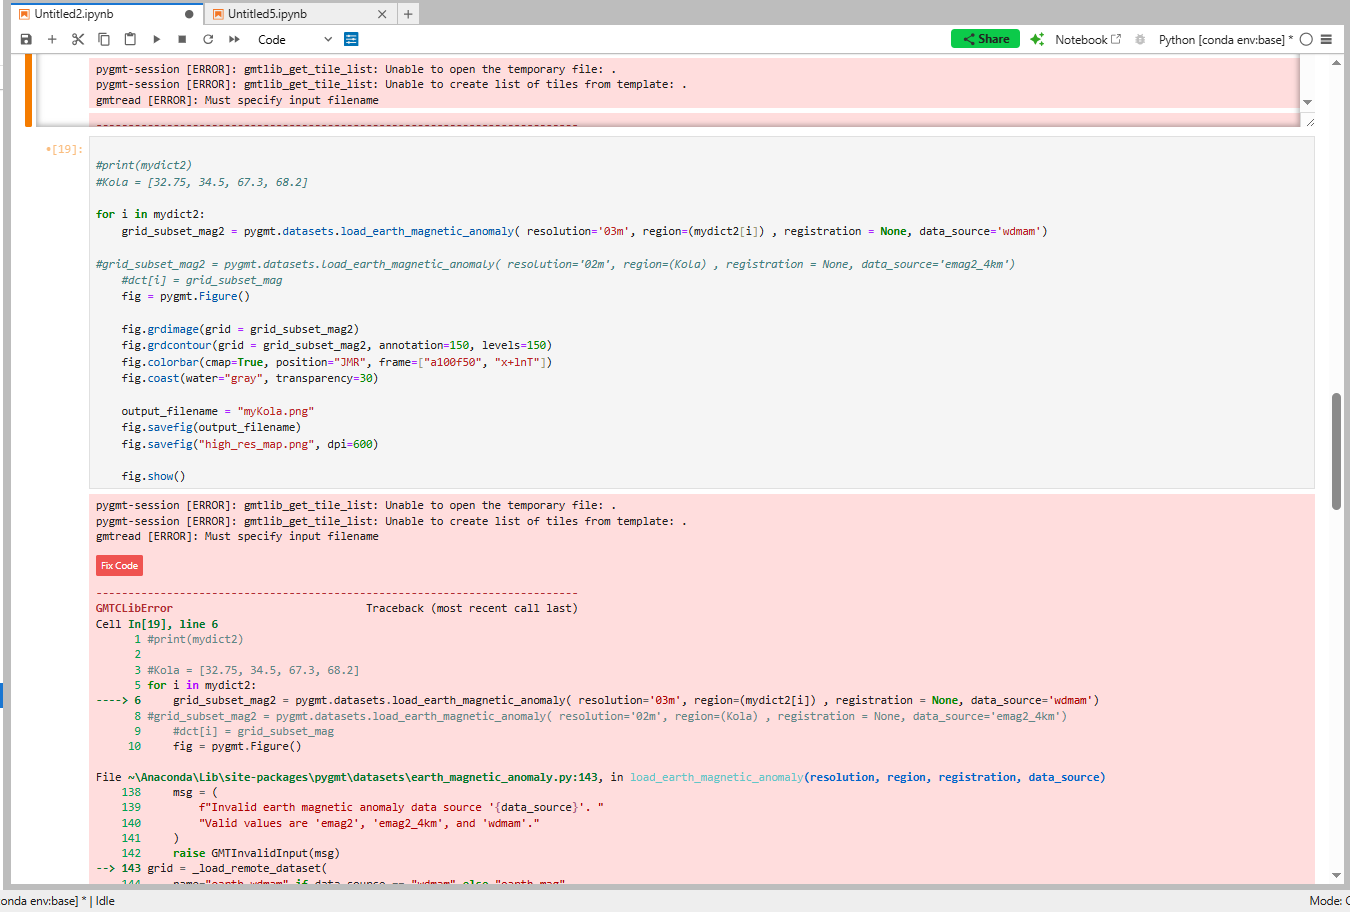
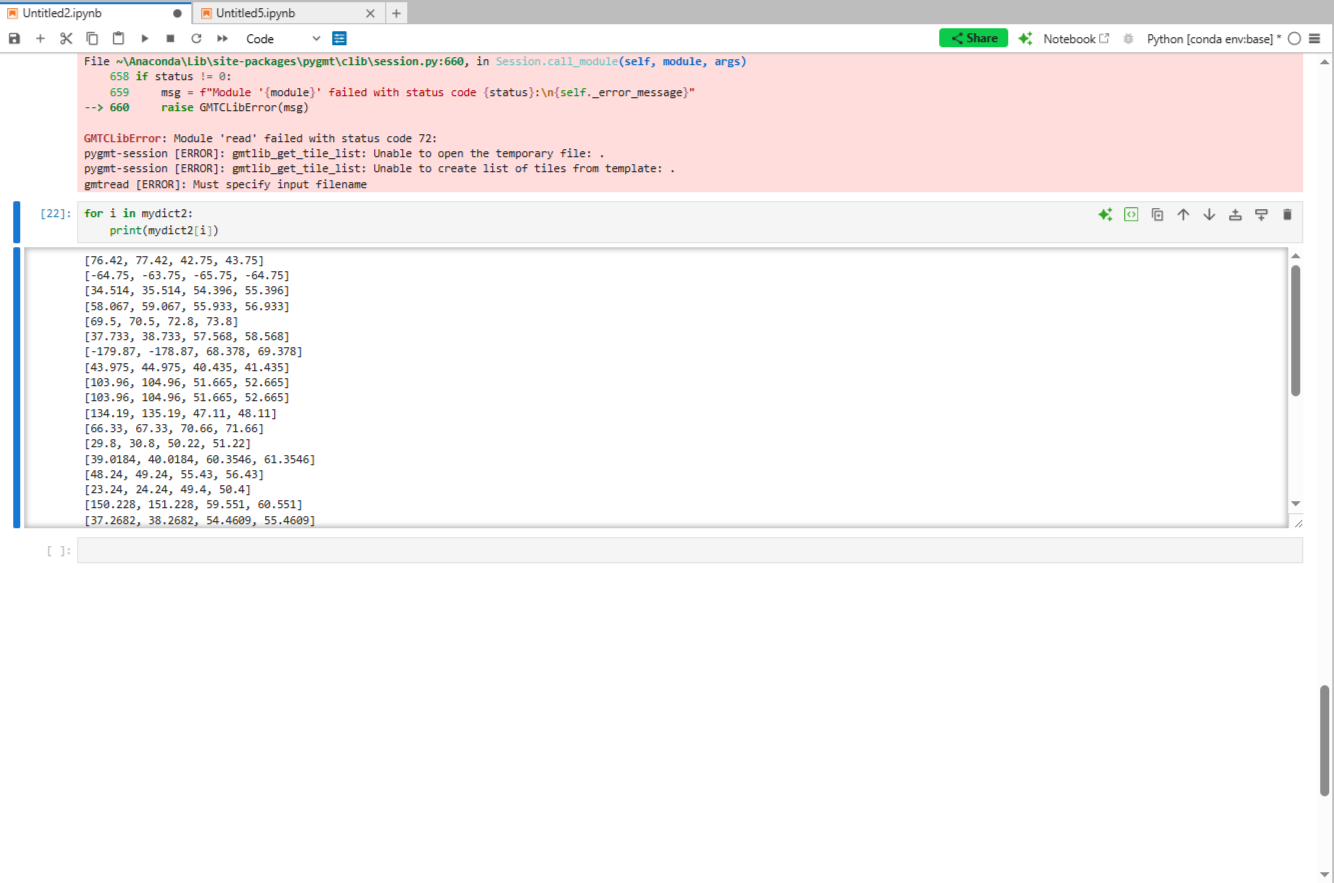
The problem is that when using the datasets.load_earth_magnetic_anomaly function from the pygmt library in a cycle, an error related to temporary files occurs: pygmt-session [ERROR]: gmtlib_get_tile_list: Unable to open the temporary file. This error is shown in the first image. If you use the same function outside the cycle, the magnetic anomaly maps are drawn as expected, as shown in Photo 2. The cycle iterates through the lists in the dictionary, which represent the four coordinates of the sector’s corners required for drawing. The dictionary elements, which are a list of coordinates, are displayed separately in Photo 3 for clarity. The question is how to solve the temporary file issue and identify its source. I have tried reinstalling the libraries, but it did not resolve the problem. The latest GMT version is 6.6.0. I have access rights to write temporary files to the folder, and I have checked this. The temporary file is also created, and I have checked this.
Here is the code:
import requests
import pygmt
import numpy as np
import matplotlib.pyplot as plt
import tempfile
import os
import pandas as pd


s = 'http://mag.gcras.ru/geomag-service/v2/ls'
response = requests.get(s)
response.raise_for_status()  # Проверяем статус
data = response.json()  #  Прямая загрузка и разбор JSON

X= [ ]
Y= []

for k in data.keys():
    # print(data[k]['Lat'], data[k]['Lon'])
    mydict[k] = [data[k]['Lat'], data[k]['Lon'] ]
    X.append(data[k]['Lon'])
    Y.append(data[k]['Lat'])

map_height_deg = 1.0  # Высота карты по широте
map_width_deg = 1.0   # Ширина карты по долготе

for elements in mydict:
    #for coordinates in elements:

        top_left_lat = mydict[elements][0] + map_height_deg / 2.0
        top_left_lon = mydict[elements][1] - map_width_deg / 2.0

        # Верхний правый угол
        top_right_lat = mydict[elements][0] + map_height_deg / 2.0
        top_right_lon = mydict[elements][1] + map_width_deg / 2.0

        # Нижний левый угол
        bottom_left_lat = mydict[elements][0] - map_height_deg / 2.0
        bottom_left_lon = mydict[elements][1] - map_width_deg / 2.0

        # Нижний правый угол
        bottom_right_lat = mydict[elements][0] - map_height_deg / 2.0
        bottom_right_lon = mydict[elements][1] + map_width_deg / 2.0

        mydict2[elements] = [top_left_lon, top_right_lon, bottom_left_lat, top_left_lat]

fig = pygmt.Figure()


for i in mydict2:
    grid_subset_mag = pygmt.datasets.load_earth_magnetic_anomaly (resolution="02m", region=i, data_source="emag2_4km" )

    fig.grdimage(grid = grid_subset_mag)
    fig.grdcontour(grid = grid_subset_mag, annotation=150, levels=150)
    fig.colorbar(cmap=True, position="JMR", frame=["a100f50", "x+lnT"])

    fig.show()