Hi There,
I was trying to plot some wiggles with wiggle and their associated uncertainties with plot, with some of the input data beyond the plot range. However, I found that although plot plots the input data as far as the points fall in the plot range, wiggle seems to fail to plot some wiggles near the plot boundary that are only partly included in the range. I am attaching a sample of my script, data files, and the output PDF file below. Note that the gray areas at the top right corner should also enclose black wiggles like the ones further to the left, but these wiggles are missing.
WiggleBoundaryProblem.zip (70.7 KB)
Can you please share the script contents as text and the output as a png file in your post? This makes it easier to help, to avoid the extra step of needing to download and extract a zip file.
You can format a block of text as code by placing three backticks (```) on a line before and after the block of code.
I am sorry about that. Below is the script. I am also attaching the output figure in PNG format and the input files. You can see that the black wiggles are missing in the top-right corner of the plot.
gmt begin WiggleBoundaryProblem png
  gmt wiggle ImageProfile_Lat46.0.wig -Jx0.72i/-0.02i -R-128/-117.5/0/150 -BWesn -Bxa1f0.5+l"Longitude (\260)" -Bya50f10+l"Depth (km)" -Z0.185i -A0 -G+red -G-blue
  gmt plot ImageProfileErr_Lat46.0.xy -Jx0.72i/-0.02i -R-128/-117.5/0/150 -Ggray
  gmt wiggle ImageProfile_Lat46.0.wig -Jx0.72i/-0.02i -R-128/-117.5/0/150 -Z0.185i -A0 -W2p,black
gmt end show

It seems that wiggle will only plot the lines if the start of the z column is in the plot region. Here is a simpler example using synthetic data:
gmt math -T-8/6/0.01 -N3/0 -C2 T 3 DIV 2 POW NEG EXP T PI 2 MUL MUL COS MUL 50 MUL = test.txt
gmt wiggle test.txt -R-10/10/-3/3 -JX3i -B -Z100i -Tfaint -W1p -BWSne -i1,0,2 -png plotted
gmt wiggle test.txt -R-10/-2/-3/3 -JX3i -B -Z100i -Tfaint -W1p -BWSne -i1,0,2 -png not-plotted
Plotted (-R-10/10/-3/3)
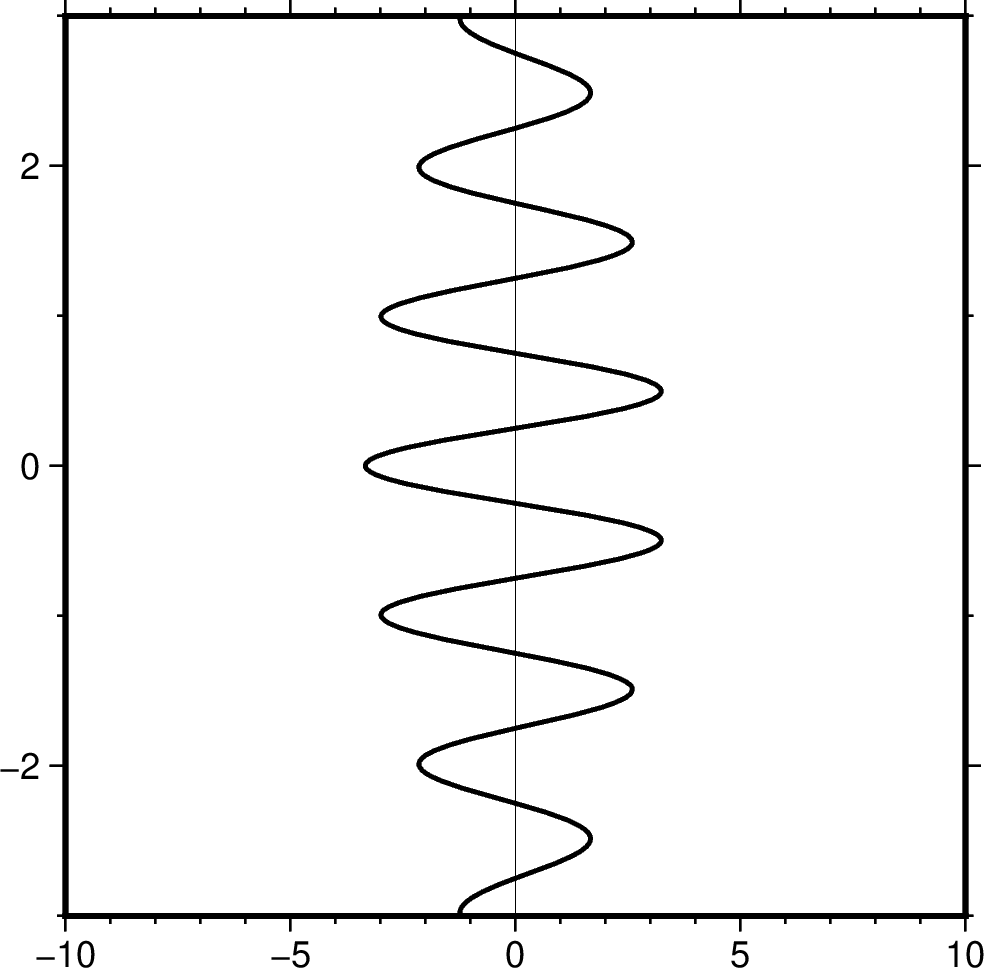
Not plotted (R-10/-2/-3/3)

I do not see any documentation in wiggle about whether this should be expected. @pwessel, would you consider this a bug?
It is certainly a feature  There is no check if the plot coordinates actually are inside if the input x,y are not.
So I would consider it a bug - please make an issue.
Thanks a lot! Just curious, how often do you release new versions with the previously reported bugs fixed?
Tianze
As soon as we fix a bug the improved version is available in GitHub so you can build it from master. Official installers and tarballs are only done 1-2 times a year, and we just did 6.3.0.
Fixed in master and merged. Thanks for the example.