On one of my previous plots, I’ve generated a segment of the Arctic Circle with:
gmt project -C-40/66.5629444444 -E40/66.5629444444 -G0.01/23.4370555556
When I tried to plot the complete Arctic Circle, i.e. 0 - 360, I got nothing; I guess it due to this: Note, when using -C and -E to generate a circle that goes through the center and end point, the center and end point cannot be farther apart than 2|colat|.
Searching the forum, I found this nice list of what I might try.
project -Z ([…] to create the coordinates of a full small circle) seems to be the appropriate thing to do. My attempt:
gmt project -Z2604.2361 -C0/90 -G0.1
             |           |      |
             1           2      3
- Difference in latitude from north pole, (90) to arctic circle (66°33′49.5″), expressed as km. I want a circle, so major axis = minor axis.
- Origin, north pole, (0,90).
- Output sample density.
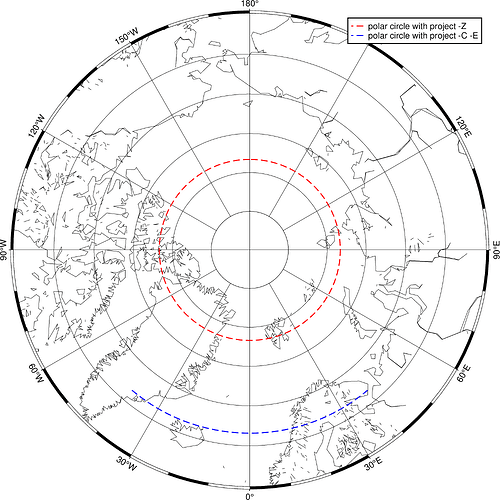
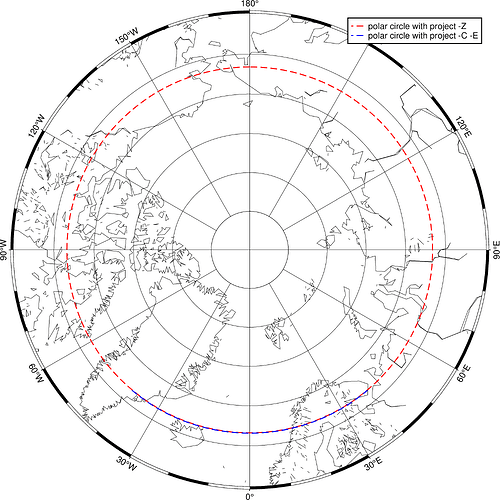
This produces a circle that is too far north (red). A segment of the Arctic Circle that is correct is seen in blue. See script and figure below. What am I doing wrong?
gmt begin arctic-circle png

gmt basemap -JS0/90/20c -Bxafg -Bya5f1g5 -R0/360/60/90
gmt coast -W -Dc
gmt project -Z2604.2361 -C0/90 -G0.1 | gmt plot -Wthick,red,- -l"polar circle with project -Z"
gmt project -C-40/66.5629444444 -E40/66.5629444444 -G0.01/23.4370555556 | gmt plot -Wthick,blue,- -l"polar circle with project -C -E"

gmt end show

