Project data into a profile

Hi!
I made a profile, and now I want to project other dataset in the profile that I have. The data that I intent to project looks like this:

data2project.txt:
lon[degE] lat[degN] depth[km] dvP[%] vP[km/s] Hit-quality
65.64546 40.96051 0 0 5.86000 0.000000
65.66415 40.64678 0 0 5.86000 0.000000
65.68267 40.33293 0 0 5.86000 0.000000
65.70103 40.01898 0 0 5.86000 0.000000

My script looks like this:

awk ‘{print $1,$2,$3,$5}’ data2project.txt: | project -C$initial_long/$initial_lati -E$final_long/$final_lati -L1/250 -S -Q -fg -Fpz >> projections.txt
xyz2grd projections.txt -R -I0.2 -Gprojection_grd.grd
grdcontour projection_grd.grd -C0.2 -R -J -K -O >> $ps

I don’t know where the error is. Someone could help me?
Many thanks in advance!

Nothing reproducible here (you parameters are not defined) and what the error might be is not shown. Best to provide a minimal working example if you want help.

Sure @pwessel!!
I want to project some contours on a profile (like in the first picture)

I have one file that have longitude ($1), latitude ($2) and the value ($5) that I want to plot in the contours

awk ‘{print $1,$2, $5}’ contours.txt | project -C$initial_long/$initial_lati -E$final_long/$final_lati -L0/250 -S -Q -fg -Fpz >> projections.txt

-projections.txt is a file with the projected contour curves.
To see if my projection is good I have plotted it in pink circles:

awk ‘{print $1,$2,$5}’ contours.txt | project -C$point1[2]/$point1[1] -E$point2[2]/$point2[1] -L0/$dist -S -Q -Fpz -S -fg | psxy -Gpink -Sc2c -R -J -K -O >> $ps

Which is not correct. After, I tried to plot the contours with:

xyz2grd proj.txt -R$rsm -I2 -V -Gpro_grd.grd
grdcontour pro_grd.grd -C2 -Wathick,red -R -J -K -O >> $ps

But I haven got the expected results yet.
One of the error that I am getting is:

xyz2grd: Mismatch between actual (2) and expected (3) fields near line 261717 (skipped)
Thanks in advance!

Still not reproducible since we have no idea what $initial_long/$initial_lati might be and contours.txt is missing.

Ok! @pwessel

This is the contour file contours1.txt (809.6 KB)
This is the one that I want to project on the shown profile. The columns that I intent to plot are the longitude (column 1), the latitude (column 2), depth (column 3) and the value of vP (column 5)

$point1[2] and $point1[1] (-C) are the initial longitude and latitude of my profile. In my case:
point1[2]= 68.5 and point1[1]=34. Same for the final point pairs (-E): point2[2]=39.0 and point2[1]= 70.0

Thanks. So the contour data have the following min/max ranges:

gmt info contours1.txt -i0,1,4 -hi1
contours1.txt: N = 18600 <65.64546/74.14299> <32.97036/41.03363> <4.81815/10.87192>

You then run project on those three columns (lon, lat, z) and the corresponding projected ranges are now

gmt project contours1.txt -i0,1,4 -hi1 -C68.5/34 -E39.0/70.0 -L0/250 -S -Q -fg -Fpz | gmt info
<Standard Input>: N = 5500 <1.3598466741/248.172687081> <5.40786/10.86254>

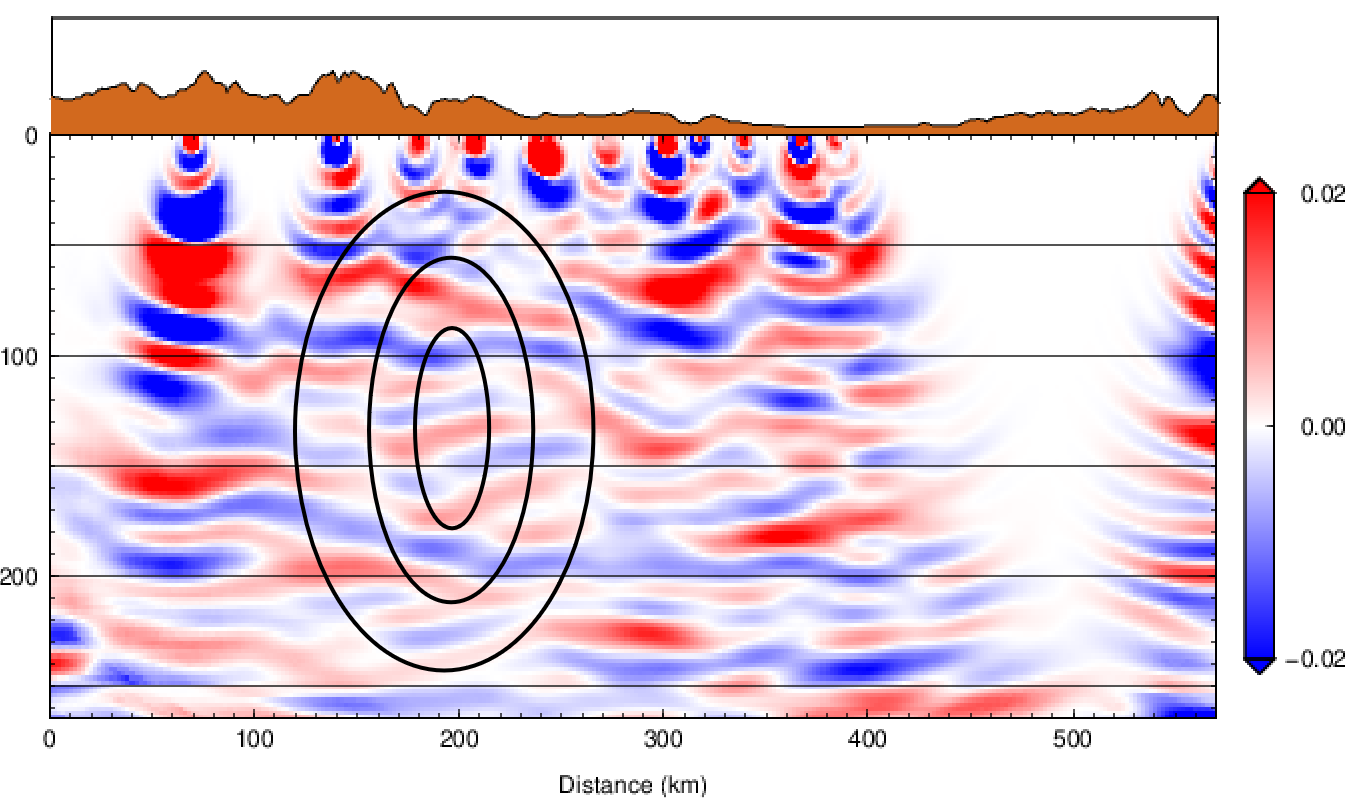
So the x-coordinates looks OK and covers a good portion of your plot above, but the y-coordinate then given to psxy goes from 5.4 to 10.9 and that is why your pink circles are only at the top. From your plot it seems the expected y-range is 0 to 250 or so. Hence, your z-column is just not compatible with that 0-250 range. So there is no error going on here. The z-values are passed along (they are not projected as they are just data values, not coordinates), so I do not understand why you say this is an error when it in fact is an exact duplication of your input data column. Is there a unit issue, i.e., you need to scale your z-values to be compatible with your desired plot range?