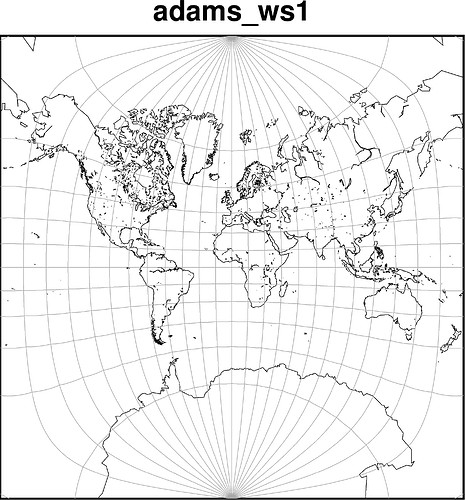
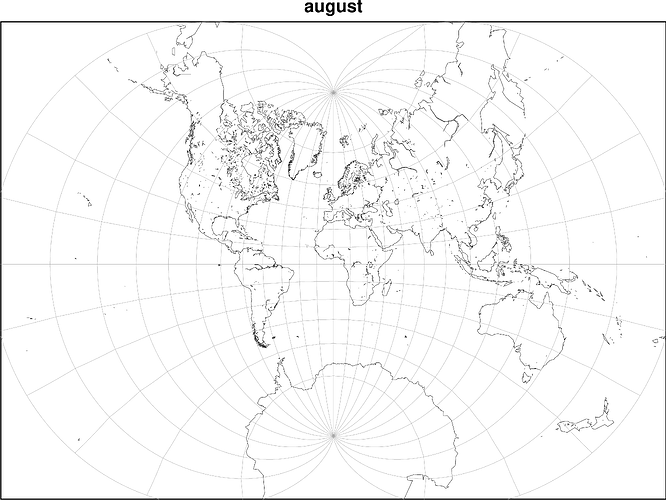
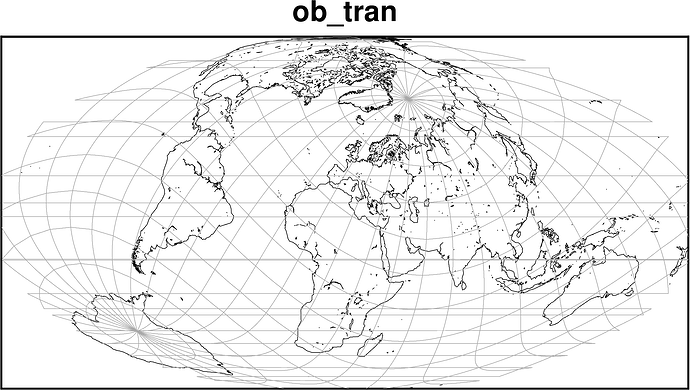
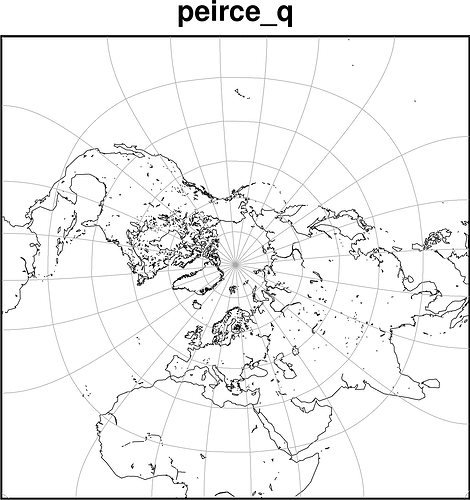
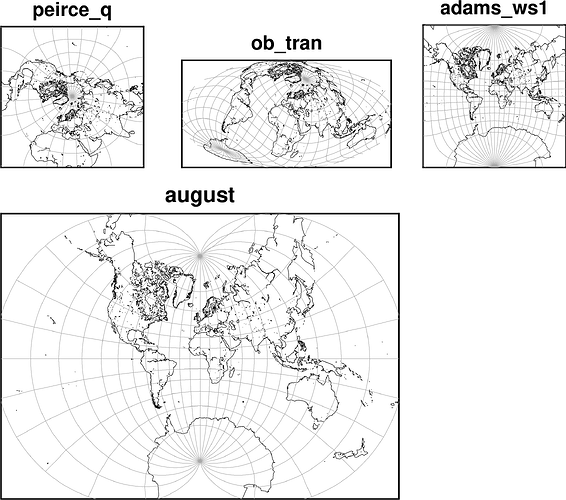
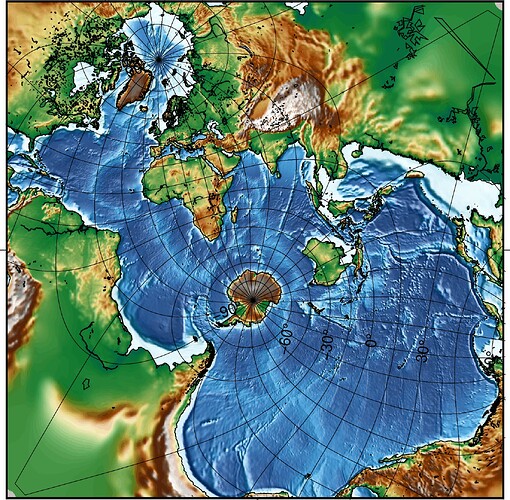
- PROJ supports more projections than GMT.
- There’s nothing holding us back from using PROJ to do the projection and then GMT to plot. The downside is that graticules, embellishment etc. have to be managed manually (…or?).
- I use SAGA GIS’s saga_cmd shapes_tools for making graticules - if anyone know of a better way, e.g. using GMT, I would be interested to know. On Debian, install with
# apt install saga.
- This is mostly for fun and testing.
- This script below produces the included four maps.
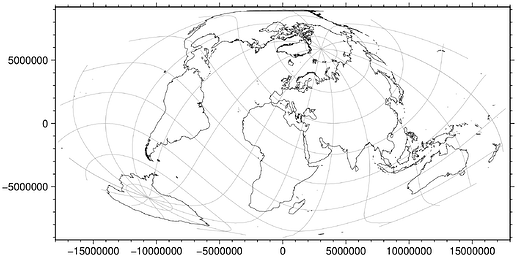
- The graticules for the ob_tran case is funky. I think it’s because of wrapping issues. Any tips?
# make graticules with sagagis
# 15 degrees between each graticule
div=15
saga_cmd shapes_tools 12 -EXTENT_X_MIN -180 -EXTENT_X_MAX 180 -EXTENT_Y_MIN -90 -EXTENT_Y_MAX 90 \
-DIVISION_X ${div} -DIVISION_Y ${div} -TYPE 0 -GRATICULE_LINE graticules.shp &> /dev/null

# convert resulting shapefile from sagagis to gmt
ogr2ogr graticules.gmt graticules.shp &> /dev/null

# the graticules from sagagis are too sparsely sampled which result strange graticules
# this can be solved by increasing the point density that the lines are built up from with sample1d
gmt sample1d graticules.gmt -Af -Fa -T10k > graticules.resampled.gmt

# common params/operations
J=-Jx1:200000000
gmt pscoast -W -Dc -Rd -M | sed "s/>/#/g" > coast

# https://proj.org/operations/projections/peirce_q.html:
gmt begin peirce_q png
proj +proj=peirce_q +lon_0=25 +shape=square coast > projcoast
R=`gmt info -I1 projcoast`
sed "s/#/>/g" projcoast | gmt plot ${J} $R -B+t"peirce_q" -B0
proj +proj=peirce_q +lon_0=25 +shape=square graticules.resampled.gmt | gmt plot -Wdarkgray
gmt end show

## https://proj.org/operations/projections/ob_tran.html:
gmt begin ob_tran png
proj +proj=ob_tran +o_proj=moll +o_lon_p=40 +o_lat_p=50 +lon_0=60 coast > projcoast
R=`gmt info -I1 projcoast`
sed "s/#/>/g" projcoast | gmt plot ${J} $R -B+t"ob_tran" -B0
# disse flipper side - kan man bruke gmt select eller gmt split? https://docs.generic-mapping-tools.org/dev/gmtsplit.html
proj +proj=ob_tran +o_proj=moll +o_lon_p=40 +o_lat_p=50 +lon_0=60 graticules.resampled.gmt | gmt plot -Wdarkgray
gmt end show

# https://proj.org/operations/projections/august.html:
gmt begin august png
proj +proj=august coast > projcoast
R=`gmt info -I1 projcoast`
sed "s/#/>/g" projcoast | gmt plot ${J} $R -B+t"august" -B0
proj +proj=august graticules.resampled.gmt | gmt plot -Wdarkgray
gmt end show

# https://proj.org/operations/projections/adams_ws1
gmt begin adams_ws1 png
proj +proj=adams_ws1 coast > projcoast
R=`gmt info -I1 projcoast`
sed "s/#/>/g" projcoast | gmt plot ${J} $R -B+t"adams_ws1" -B0
proj +proj=adams_ws1 graticules.resampled.gmt | gmt plot -Wdarkgray
gmt end show

# clean up
rm graticules.* coast projcoast
3 Likes
Here’s a better and more efficient version.
- all figures created within one single modern session
- add
-gX1c to fix the wrapping of graticules for +proj=ob_trans.
# make graticules with sagagis
# 15 degrees between each graticule
div=15
saga_cmd shapes_tools 12 -EXTENT_X_MIN -180 -EXTENT_X_MAX 180 -EXTENT_Y_MIN -90 -EXTENT_Y_MAX 90 \
-DIVISION_X ${div} -DIVISION_Y ${div} -TYPE 0 -GRATICULE_LINE graticules.shp &> /dev/null

# convert resulting shapefile from sagagis to gmt
ogr2ogr graticules.gmt graticules.shp &> /dev/null

# the graticules from sagagis are too sparsely sampled which result strange graticules
# this can be solved by increasing the point density that the lines are built up from with sample1d
gmt sample1d graticules.gmt -Af -Fa -T10k > graticules.resampled.gmt

# common params/operations
J=-Jx1:500000000
gmt pscoast -W -Dc -Rd -M | sed "s/>/#/g" > coast

# https://proj.org/operations/projections/peirce_q.html:
gmt begin project-with-proj-and-plot-with-gmt png
proj +proj=peirce_q +lon_0=25 +shape=square coast > projcoast
R=`gmt info -I1 projcoast`
sed "s/#/>/g" projcoast | gmt plot ${J} $R -B+t"peirce_q" -B0
proj +proj=peirce_q +lon_0=25 +shape=square graticules.resampled.gmt | gmt plot -Wdarkgray

## https://proj.org/operations/projections/ob_tran.html:
proj +proj=ob_tran +o_proj=moll +o_lon_p=40 +o_lat_p=50 +lon_0=60 coast > projcoast
R=`gmt info -I1 projcoast`
sed "s/#/>/g" projcoast | gmt plot ${J} $R -B+t"ob_tran" -B0 -X6c
# use -gX1c to avois wrapping
proj +proj=ob_tran +o_proj=moll +o_lon_p=40 +o_lat_p=50 +lon_0=60 graticules.resampled.gmt | gmt plot -Wdarkgray -gX1c

# https://proj.org/operations/projections/adams_ws1
proj +proj=adams_ws1 coast > projcoast
R=`gmt info -I1 projcoast`
sed "s/#/>/g" projcoast | gmt plot ${J} $R -B+t"adams_ws1" -B0 -X8c
proj +proj=adams_ws1 graticules.resampled.gmt | gmt plot -Wdarkgray

# https://proj.org/operations/projections/august.html:
proj +proj=august coast > projcoast
R=`gmt info -I1 projcoast`
sed "s/#/>/g" projcoast | gmt plot ${J} $R -B+t"august" -B0 -X-14c -Y-11c
proj +proj=august graticules.resampled.gmt | gmt plot -Wdarkgray
gmt end

# clean up
rm graticules.* coast projcoast gmt.history
2 Likes
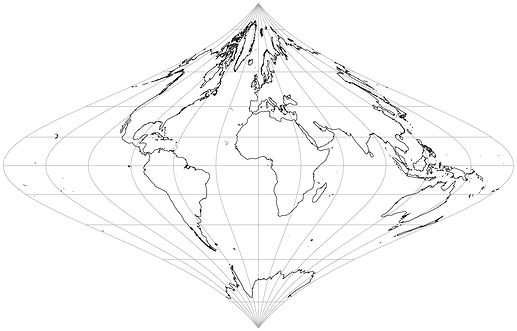
julia> cl = coastlinesproj(proj="fouc");
julia> grid = graticules(cl);
julia> imshow(grid, plot=(data=cl,), lc=:darkgray, frame=:none)
@pwessel, WTF do we have to do to calculate a frame in projections like this one where the frame is not along a constant longitude?
julia> cl = coastlinesproj(proj="+proj=ob_tran +o_proj=moll +o_lon_p=40 +o_lat_p=50 +lon_0=60");
julia> grid = graticules(cl);
julia> imshow(grid, plot=(data=cl,), lc=:darkgray)
You know it is just an ellipse and you draw it as the base frame
Hmm, not going to spend not available time with this one but only way I see to find that ellipse would be to fit one from the extremes of the graticule.
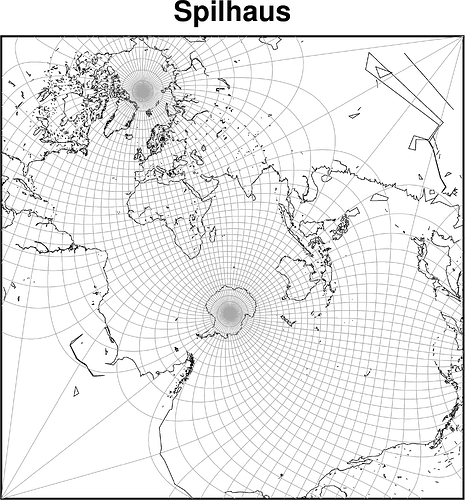
Spilhaus:
div=5
saga_cmd shapes_tools 12 -EXTENT_X_MIN -180 -EXTENT_X_MAX 180 -EXTENT_Y_MIN -90 -EXTENT_Y_MAX 90 \
-DIVISION_X ${div} -DIVISION_Y ${div} -TYPE 0 -GRATICULE_LINE graticules.shp &> /dev/null

ogr2ogr graticules.gmt graticules.shp &> /dev/null

gmt sample1d graticules.gmt -Af -Fa -T10k > graticules.resampled.gmt

gmt pscoast -W -Dc -Rd -M | sed "s/>/#/g" > coast

# https://proj.org/en/stable/operations/projections/spilhaus.html
gmt begin spilhaus png

proj +proj=spilhaus coast > projcoast
R=`gmt info -I1 projcoast`
sed "s/#/>/g" projcoast | gmt plot -Jx1:200000000 $R -B+t"Spilhaus" -B0 -gX1c
proj +proj=spilhaus graticules.resampled.gmt | gmt plot -Wdarkgray -gX1c

gmt end show
3 Likes
you can simplify those with
gmt pscoast -W -Dc -Rd -M | gmt mapproject -J+proj=spilhaus > projcoast
Yes, I know. But I’m not used to using EPSG codes in GMT, yet.
PS: That also depends of the version you have installed of PROJ, right? The projections are not hard coded in the gmt source?
Right. But likewise for your proj +proj=spilhaus command. You need a fairly recent PROJ version to use either (GMT or PROJ)
With that fairly recent (9.6) and GMT master
gmt grdimage @earth_relief_15m -I -Rd -J+proj=spilhaus+width=14 -P -K > spilhaus.ps
gmt pscoast -R -J -W0.5 -BWbet -B30g -O >> spilhaus.ps
3 Likes
