Hi PyGMT experts,
Thank you for making PyGMT, and for the great efforts in updating and improving the packages. It is very much appreciated.
I have two issues. Do I need to make two different topics?
I am using
pygmt.__version__
'v0.5.1.dev15'
The first issue:
This may be a bug. I a trying to make a polar sterographic plot of Antarctica, but it is only working when I use projection -Js and not -JS (using ordinary GMT notation). Here, is an example:
grid = pygmt.datasets.load_earth_relief(resolution="05m", region=[-180,180,-90,-40])
fig = pygmt.Figure()
fig.basemap(region="-130/-50/45/-50r", projection="S0/-90/-70/8c", frame="a20f20")
I get this error:
basemap [ERROR]: Option -J parsing failure. Correct syntax:
-Js<lon0>/<lat0>[/<horizon>]/<scale> OR -JS<lon0>/<lat0>[/<horizon>]/<width>
<horizon> is distance from center to perimeter (< 180, default 90)
<scale> is <1:xxxx>, <lat>/<1:xxxx>, or <radius> (in cm)/<lat>, or use <width> in cm
basemap [ERROR]: Offending option -JS0/-90/-70/8c
Traceback (most recent call last):
  File "<stdin>", line 1, in <module>
  File "/g5/procdata/skr/anaconda3/envs/pygmt4/lib/python3.9/site-packages/pygmt/helpers/decorators.py", line 586, in new_module
    return module_func(*args, **kwargs)
  File "/g5/procdata/skr/anaconda3/envs/pygmt4/lib/python3.9/site-packages/pygmt/helpers/decorators.py", line 726, in new_module
    return module_func(*args, **kwargs)
  File "/g5/procdata/skr/anaconda3/envs/pygmt4/lib/python3.9/site-packages/pygmt/src/basemap.py", line 84, in basemap
    lib.call_module("basemap", build_arg_string(kwargs))
  File "/g5/procdata/skr/anaconda3/envs/pygmt4/lib/python3.9/site-packages/pygmt/clib/session.py", line 500, in call_module
    raise GMTCLibError(
pygmt.exceptions.GMTCLibError: Module 'basemap' failed with status code 72:
basemap [ERROR]: Option -J parsing failure. Correct syntax:
basemap [ERROR]: Offending option -JS0/-90/-70/8c
This works with no problems:
 grid = pygmt.datasets.load_earth_relief(resolution="05m", region=[-180,180,-90,-40])
 fig = pygmt.Figure()
 fig.basemap(region="-130/-50/45/-50r", projection="s0/-90/-70/1:5000000", frame="a20f20")
 fig.grdimage(grid=grid, cmap="gray")
 fig.savefig('test.png', show=True)
Am I doing something wrong? I have tried to plot the same thing with a northern polar stereographic projection (projection="S-45/90/70/8c), but with no issues. I can live with using the “Js” solution, but I just find it strange,
Second issue
I would like to plot projected data on top of an earth relief grid. How do I do this? Do I need to reproject the earth relief data first? I have used this example (42) Antarctica and stereographic data — GMT 6.5.0 documentation to plot fx. coastlines in geographical coordinates on top of my projected data. This works, but when I start by using the geographical coordinates (fx. plotting earth relief as a background) with my projected data on top it goes wrong:
# grid_relief = pygmt.datasets.load_earth_relief(resolution="05m", region=[-180, 180, -90, -40)

region = "-130/-52/45/-50r"
fig = pygmt.Figure()
# fig.grdimage(grid=grid_relief, region=regionr, cmap="gray", projection="s0/-90/-70/1:50000000") ## Wanted to make a background map
pygmt.config(PROJ_ELLIPSOID="WGS-84")
pygmt.makecpt(cmap="devon", series=[0,100])
fig.grdimage(grid=ds, cmap=True, projection="x1:50000000") ## My projected data (test.nc)
fig.basemap(region=region, projection="s0/-90/-70/1:50000000", frame=[frame[0], frame[1], f'+t"{title}"'])
fig.coast(shorelines="0.5p,black",  projection=""s0/-90/-70/1:50000000, frame=['WSEn', frame[0], frame[1]])
I have uncommented the lines that do not work! My workaround right now is to reproject my input data through Pythons pyproj, but I guess it is possible in pyGMT to plot it without the reprojection.!
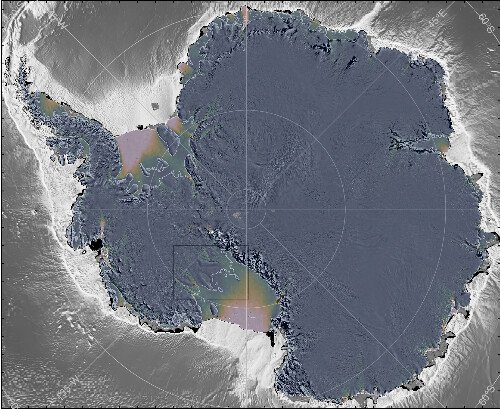
Below I have attached two figures. The first shows my projected data (satellite tracks) without the background relief and the second figure show the background image, but no projected data.
I have also played around with grdproject, but this does not give me any valied values:
ds_proj = pygmt.grdproject(grid=ds, projection="s0/-90/-70/1:50000000", region=regionr, inverse=True)


