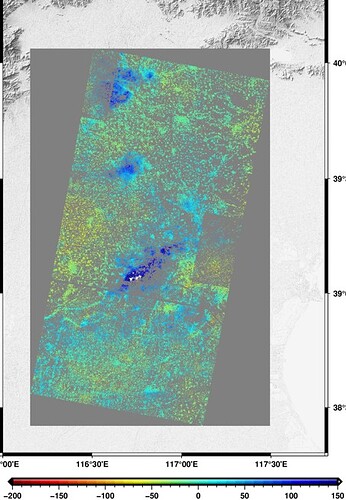
Hello, everyone. my requirement is to plot the deformation map generated by ps-insar on the relief map, the deformation map is a number of points, I use xyz2grd to plot the deformation field, but this command needs to specify -R and -I, my deformation field is a tilted projection, so I add +r after -R, and set -I to 0.001, my code is as follows.
gmt begin stamps png
gmt set MAP_GRID_PEN_PRIMARY 0.25p,gray,2_2
gmt set FONT_TITLE 7p,Helvetica-Bold
gmt set FONT_ANNOT 7p,Helvetica-Bold
gmt set FONT_LABEL 7p,Helvetica-Bold
gmt set MAP_TITLE_OFFSET 1.3P
gmt set MAP_SCALE_HEIGHT 5p
gmt makecpt -Cjet -T-200/150/10 -H -Iz > jetforstamps.cpt
gmt grdimage @earth_relief_01s -JM10c -Bxa0.5 -Bya0.5 -BWSEN -R116/117.8/38.3/40.5 -CgrayC -I
gmt xyz2grd stamps_disp.txt -R/116.1540/38.4191/117.4934/40.0614+r -I0.001 -Gstamps_disp.grd
gmt grdimage stamps_disp.grd -Cjetforstamps.cpt
gmt colorbar -Dx0.3c/-1c+w10.1c/0.2c+h+e -Bxaf -Bx+l"disp(mm)" -Cjetforstamps.cpt -I
gmt end show
The area of the graph is a rectangle diagonal to the line joining the two corner points I specified, the area with no value is grey, not just the tilted deformation field. Also, my deformation field is discrete points and I don’t think it makes sense to specify -I to generate the grid. My image is below.
How do I change the command, or use a different one? Thank you very much for your attention!
