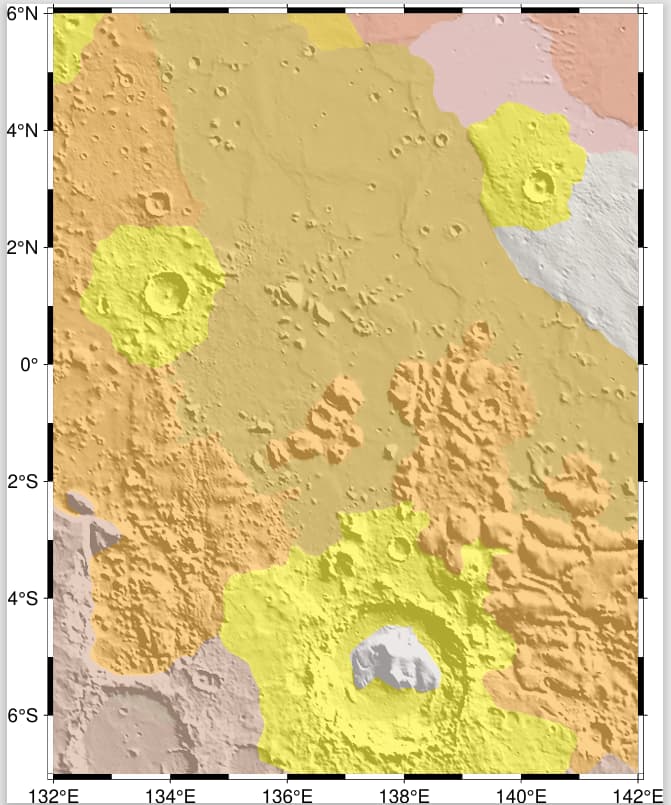
The GMT ‘psclip’ command can use the ‘polygonal clip paths’ function. This allows one to select any shape of area to show. I just wonder how to do this in pyGMT.
I want to do this because I want to plot a topography map with shading/intensity, but I want the colors to show the geology units (e.g, continental plates on Earth) instead of the topography values.
Thanks for any suggestions.
The following is an example of what I want.
But this is done by overlapping pure-colored geology units and 50% transparent grey-colored topography. Not perfect.
Hi WanboXiao. Welcome to the forum.
First, I think your example map look good. I would only add boundaries with a thin pen and a dark color (not black, maybe, dark grey) to highlight the boundaries a bit.
With regard to clipping, I think it is not implemented in pyGMT as e.g. basemap.
It is possible to call clip using GMT C API. I did it to clip a background map and a grid to a coastline, so I could not avoid using clip the way your example shows. Then I made the whole map using GMT C API calls. Mixing C API calls and pyGMT calls is apparently not possible (at least it did not work for me).
something like below, actually very similar to calling GMT modules using bash
from pygmt.clib import Session
with Session() as s:
    # begin
    args = ['test-clib-Session', 'png', '-C']
    s.call_module('begin', args=' '.join(args))

    # coastline in binary format like in GMT example 51:
    OSM_LAND_POLY='OSM_LAND_POLYGONS.b2f'
    J = '-Jm1:50000' # a projection string
    ROI = '-RW/S/E/N' # a region string
    args = [OSM_LAND_POLY, J, ROI, ' -bi2f', '-N']
    session.call_module('clip', args=' '.join(args))
    #... plot your grid, background map etc the same way,
    # by session.call_module with string arguments like CLI GMT
    session.call_module('clip', args='-C1')
    # end
    s.call_module('end', args='show')
1 Like
Thanks, mkononets.
I understand that you are calling the ‘clip’ command in GMT but in the Python script.
It looks to me the ultimate way to solve any not-yet-corporated GMT commands, though the programming syntax may looks a bit more complex.
This happens to solve my another concern, not all GMT commands are corporated in pyGmt yet.
It seems perfectly possible to mix C API and pyGMT calls, which is really great. I don’t remember what experience made me writing the above statement.
like, in my case it is clipping water out of the background map raster:
import pygmt
from pygmt.clib import Session
my_fig = pygmt.Figure()

# Initialize clipping path, clip out water using OSM land polygons
BB_OSM_LAND_POLY = 'BB_OSM_land_polygons.b2f'
with Session() as s:
    args = [f'{BB_OSM_LAND_POLY} -bi2f', f'-R{region_WSEN} -Jm1:50000 -N']
    s.call_module('clip', args=' '.join(args))

# Draw tilemap
fig.tilemap(
    region=region_LL_UR
    projection='x1:50000',
    lonlat=False,
    zoom=14,
    dpi=600,
    # Use tiles from OpenStreetMap tile server
    source="https://{s}.tile.openstreetmap.org/{z}/{x}/{y}.png")

# Finalize clipping
with Session() as s:
    s.call_module('clip', args='-C1')

# ... some other plotting calls ...

my_fig.savefig("test_fig.png",show=True)
