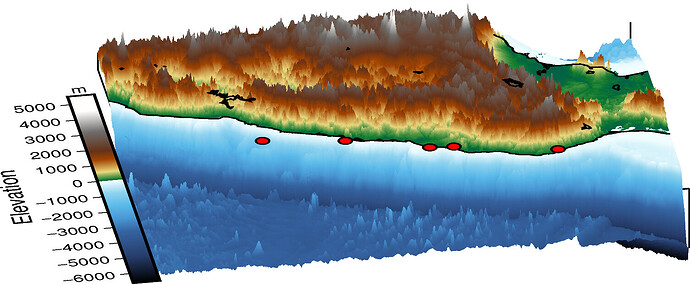
I have not used PyGMT much yet, but I was very happy to be able to get some nice 3D perspective views of topography and bathymetry with some of the examples posted, with the very nice automatic download of the data with the pygmt.datasets.load_earth_relief method. I am making figures for the southern part of Mexico, so I used views of the topography looking to the north, and those look great. It is very helpful that it automatically adjusts the CPT to cover the span of the data, while keeping the transition from the “land” colors to the “ocean” colors right at sea level.
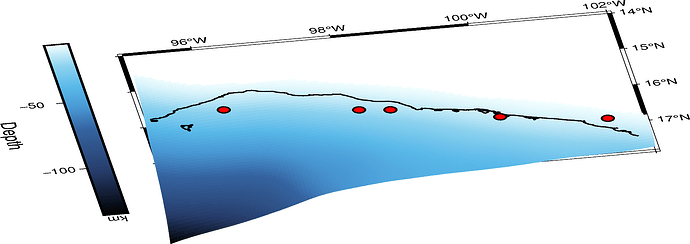
Then I decided to try making a 3D perspective view of the subducting Cocos Plate slab, using the Slab2 database from Hayes et al. (2018). It makes more sense to look at the slab from the north looking to the south perspect = [10, 30]. The view looks quite good, but it seems the colorbar plotting is confused about which way is “up” and “right”. I figured out that I had to use the JMR flag to get the scale bar on the left side of the perspective plot. I also had to use a negative length to have the colors going “down”. The only thing I could not figure out how to turn or flip is the units label. I don’t know if this is a bug or the way it is supposed to work. I am also not sure whether this is from the PyGMT or regular GMT code.
This is the full colorbar call:
fig.colorbar(
perspective=True,
frame=[“a50”, “x+lDepth”, “y+lkm”],
position=“JMR+o1c/0c+w-7c/0.5c”,
)
By the way, it would be nice to include the Slab2 database in the GMT Remote datasets.

