I am attempting to plot and color the polygons from a geologic map kml file I converted to a gmt file but I don’t understand how to color the polygons. I’ve been able to plot the polygon outlines using the method here, but I want to color by name of the category or a dictionary of colors matched to the names. However, when I try to assign a category to the names and color by cmap such as in this example, I get the error: “pygmt.exceptions.GMTInvalidInput: Can’t use arrays for color if data is matrix or file.”. How can I color the polygons?
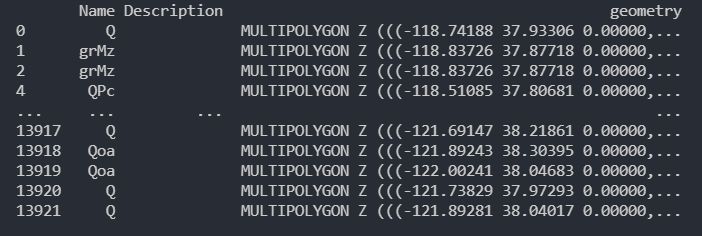
Dataframe generated from the gmt file:
The working part of my code that plots the polygon outlines:
import geopandas as gpd
import pygmt
import pandas as pd

gpd.io.file.fiona.drvsupport.supported_drivers['KML'] = 'rw'

# reads kml file
df_polygons = gpd.read_file('GMC_geo_poly.kml', driver='KML')

# converts kml file to gmt
df_polygons.to_file('GMC_geo_poly.gmt', driver='OGR_GMT', )

# reads gmt file
df_polygons = gpd.read_file('GMC_geo_poly.gmt', driver='OGR_GMT')

region = [-125, -122, 39, 41]

fig = pygmt.Figure()

fig.basemap(
    region=region,
    projection='M6i',
    frame='f'
)

fig.coast(
    shorelines='0.5p,black',
    resolution='h',
    water='lightskyblue2',
    transparency= 50,
)

# plots the polygons from the gmt file
fig.plot(
    data = 'GMC_geo_poly.gmt',
)

# saves a copy of the generated figure
fig.savefig('GMC_geo_poly.png')
fig.show()
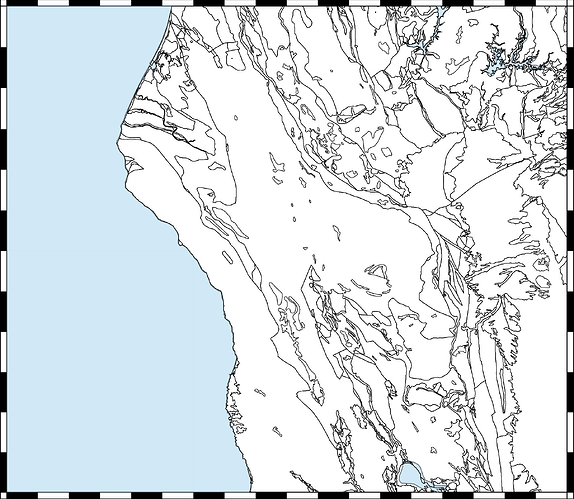
What I’ve been able to create:
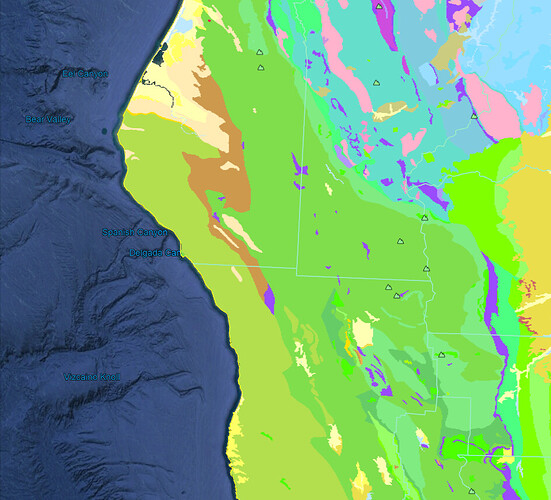
What I ultimately want something similar to:
Hi @hazardgoat, thanks for trying PyGMT! You may need to convert the dictionary of {names:colors} into a categorical CPT file first (as mentioned in Coloring polygon). The mycategorical.cpt plaintext file should look something like:
Q      red
grMz   blue
QPc    green
Then, you can use fig.plot(..., cmap="mycategorical.cpt", color="+z", a="Z=Name") or something along those lines (refer to How to color polygons of a geopandas dataframe in pygmt? and https://www.pygmt.org/v0.3.1/api/generated/pygmt.Figure.plot.html).
If possible, please share the fig.plot command you are using and the “GMC_geo_poly.gmt” file (you can upload it as a zip file) so that we can assist further. Coloring polygons can be a bit tricky in PyGMT/GMT so it’s best to know what we’re working with.
1 Like
Thank you for helping me with this! I attempted coloring by categorical CPT following the method in the links you provided as best I can, but no figure is generated at the end when I try it. The gmt file is too large to upload to this site, so here is a google drive link that contains the files in addition to the source klm.
The full script is in the google drive, but the fig.plot command I’m using is:
fig.plot(
    data = 'GMC_geo_poly.gmt',
    cmap = polyColor_cpt,
    color = '+z',
    a = 'Z = Name',
    )
and the cpt file looks like this:
C   255/222/153
Ca  153/128/235
D	255/179/153
E	77/179/235
E-Ep	77/179/236
Ec	77/153/222
Ep	77/153/204
gb	255/153/179
gr  204/153/255
gr-m    204/128/235
grCz	255/204/255
grCz?	255/204/256
grMz	204/179/255
grMz?	204/179/256
grpC	235/77/255
grpC?	235/77/256
grPz	179/102/255
J	128/255/77
J?	128/255/78
K	0/255/179
K?	0/255/180
KJf	77/222/128
KJfm	102/204/102
KJfs	128/235/128
Kl	0/255/128
Kl?	0/255/129
Ku	102/255/153
Ku-Ep	102/255/154
ls	222/153/77
m	222/153/204
mv	222/153/205
M	0/222/255
M?	0/222/256
M+KJfs	0/222/257
Mc	0/204/222
Mzv 0/255/77
O	128/222/235
Oc	128/204/204
Oc?	128/204/205
pC	128/128/204
pCc	128/128/179
P	179/235/255
Pm	255/255/102
Pz	204/222/102
Pzv	255/222/128
Q	179/255/255
Qg	204/204/204
Qls	0/255/255
Qoa	102/255/255
QPc	77/222/235
Qrv	0/153/255
Qrvp	0/128/255
Qs	235/255/255
Qv	0/77/255
Qv?	0/77/256
Qvp	0/77/204
Qvp?	0/77/205
sch	222/204/128
SO	255/179/204
Tc	77/179/255
Ti	77/0/245
TK	77/222/179
Tr	204/255/102
Tv	102/102/255
Tvp	102/102/204
um	255/77/153
B	black
F	white
N	127.5
Some of your colors have a value of 256, e.g., 204/179/256. However, valid RGB values are 0-255.
1 Like
Thank you!!! As it turns out, while I did catch those shortly after posting about the “failed to decode” error, there was an additional RGB value error that I missed. Now it colors the polygon lines to the cmap, but doesn’t yet fill them. Do you have any further insights you’d be willing to lend me?
EDIT: Setting close=True in fig.plot filled in the polygons!
1 Like


