Hi friends
I have two doubts about pygmt.config:
The first one is about to plot the result of some SECONDARY options for MAP frame. I have succeeded to change some PRIMARY options, but not the SECONDARY. I want to plot primary and secondary options available in GMT.
The second doubt is about seeing the changing effects of pygmt.config. I am programming my scripts in anaconda-sypeder (Spyder IDE in windows 10 pro). For plotting and seeing the changes, I have to restart the kernel of Spyder-IDE ¿Is there another way to avoid the restart the kernel every time I want to change pygmt.config?
Best Regards Adrián
The following piece of the script would help you understand my doubt (the first and second one).
import os
import time
import pygmt as gmt

direc = 'D:\\fold_AEDM_DoctoradoCI_PUC\\FOLD_Cursos_Doctorado\\fold_ING5250_Autoria-Articulo_Publicacion-Revista\\fold_RA-Outline_CDP0006\\fold_Figuras\\Figure_1_Placas_Terremotos_PGA\\fold_Fig1_GMT\\'
os.chdir(direc)

gmt.show_versions()

tia = time.process_time()
tib = time.time()

gmt.config(MAP_FRAME_TYPE='plain')
gmt.config(FORMAT_GEO_MAP='ddd')
gmt.config(MAP_GRID_CROSS_SIZE_PRIMARY=0.15)
#gmt.config(MAP_GRID_CROSS_SIZE_SECONDARY=0.25)
#gmt.config(MAP_TICK_PEN_PRIMARY=1)
#gmt.config(MAP_TICK_PEN_SECONDARY=0.5)
gmt.config(MAP_TICK_LENGTH_PRIMARY=0.25)
#gmt.config(MAP_TICK_LENGTH_SECONDARY=0.15)

##  generación de la clase fig
fig = gmt.Figure()

## Construcción de la base
region = [-85, -60, -57, -15]
projection = 'M10c'
fig.basemap(region=region, projection=projection, frame=['ag', 'WSne'])

### Ayuda a coordenadas
fig.basemap(region=region, projection=projection, frame=['ag', 'WSne'])

##  Se muestra la figura
fig.show()

tfa = time.process_time()
tfb = time.time()
print('\n\t process_time: %5.3f (s)   time: %5.3f (s) \n' % ((tfa-tia), (tfb-tib)))

del tia, tib, tfa, tfb
del direc
Hi @aedmpygmt, I can’t quite understand your first question on SECONDARY MAP options, but for your second issue on having to restart the kernel every time, I recommend using pygmt.config in a Python with context manager like so:
import pygmt as gmt

##  generación de la clase fig
fig = gmt.Figure()

with gmt.config(
    MAP_FRAME_TYPE='plain',
    FORMAT_GEO_MAP='ddd',
    MAP_GRID_CROSS_SIZE_PRIMARY=0.15,
):
    fig.basemap(...)

fig.show()
One thing to note here. It is best to call pygmt.config after fig = gmt.Figure(), so that the configuration settings apply only to the figure you want to plot. This is especially important if you call fig=gmt.Figure() many times in one script.
As for your 1st question, maybe you can upload your figure, and let us know what exactly you wish to change, and we can provide suggestions.
Hi wiji14
First it all, your suggestion about
gmt.config(
    MAP_FRAME_TYPE='plain',
    FORMAT_GEO_MAP='ddd',
    MAP_GRID_CROSS_SIZE_PRIMARY=0.15)
after fig = gmt.Figure() worked ok. for my script, because it is not necessary to restart the kernel of my anaconda-spyder if I call the script many times. Thanks
I will try to explain my first question. For my script, I am interested to use other options of pygmt.config. For example, if I want to use the option MAP_TICK_LENGTH_SECONDARY=0.25 it does not plot. The same happens if I want to use other options: MAP_TICK_PEN_SECONDARY, MAP_GRID_PEN_SECONDARY,
GRID_CROSS_SIZE_SECONDARY, …, etc (or any _SECONDARY).
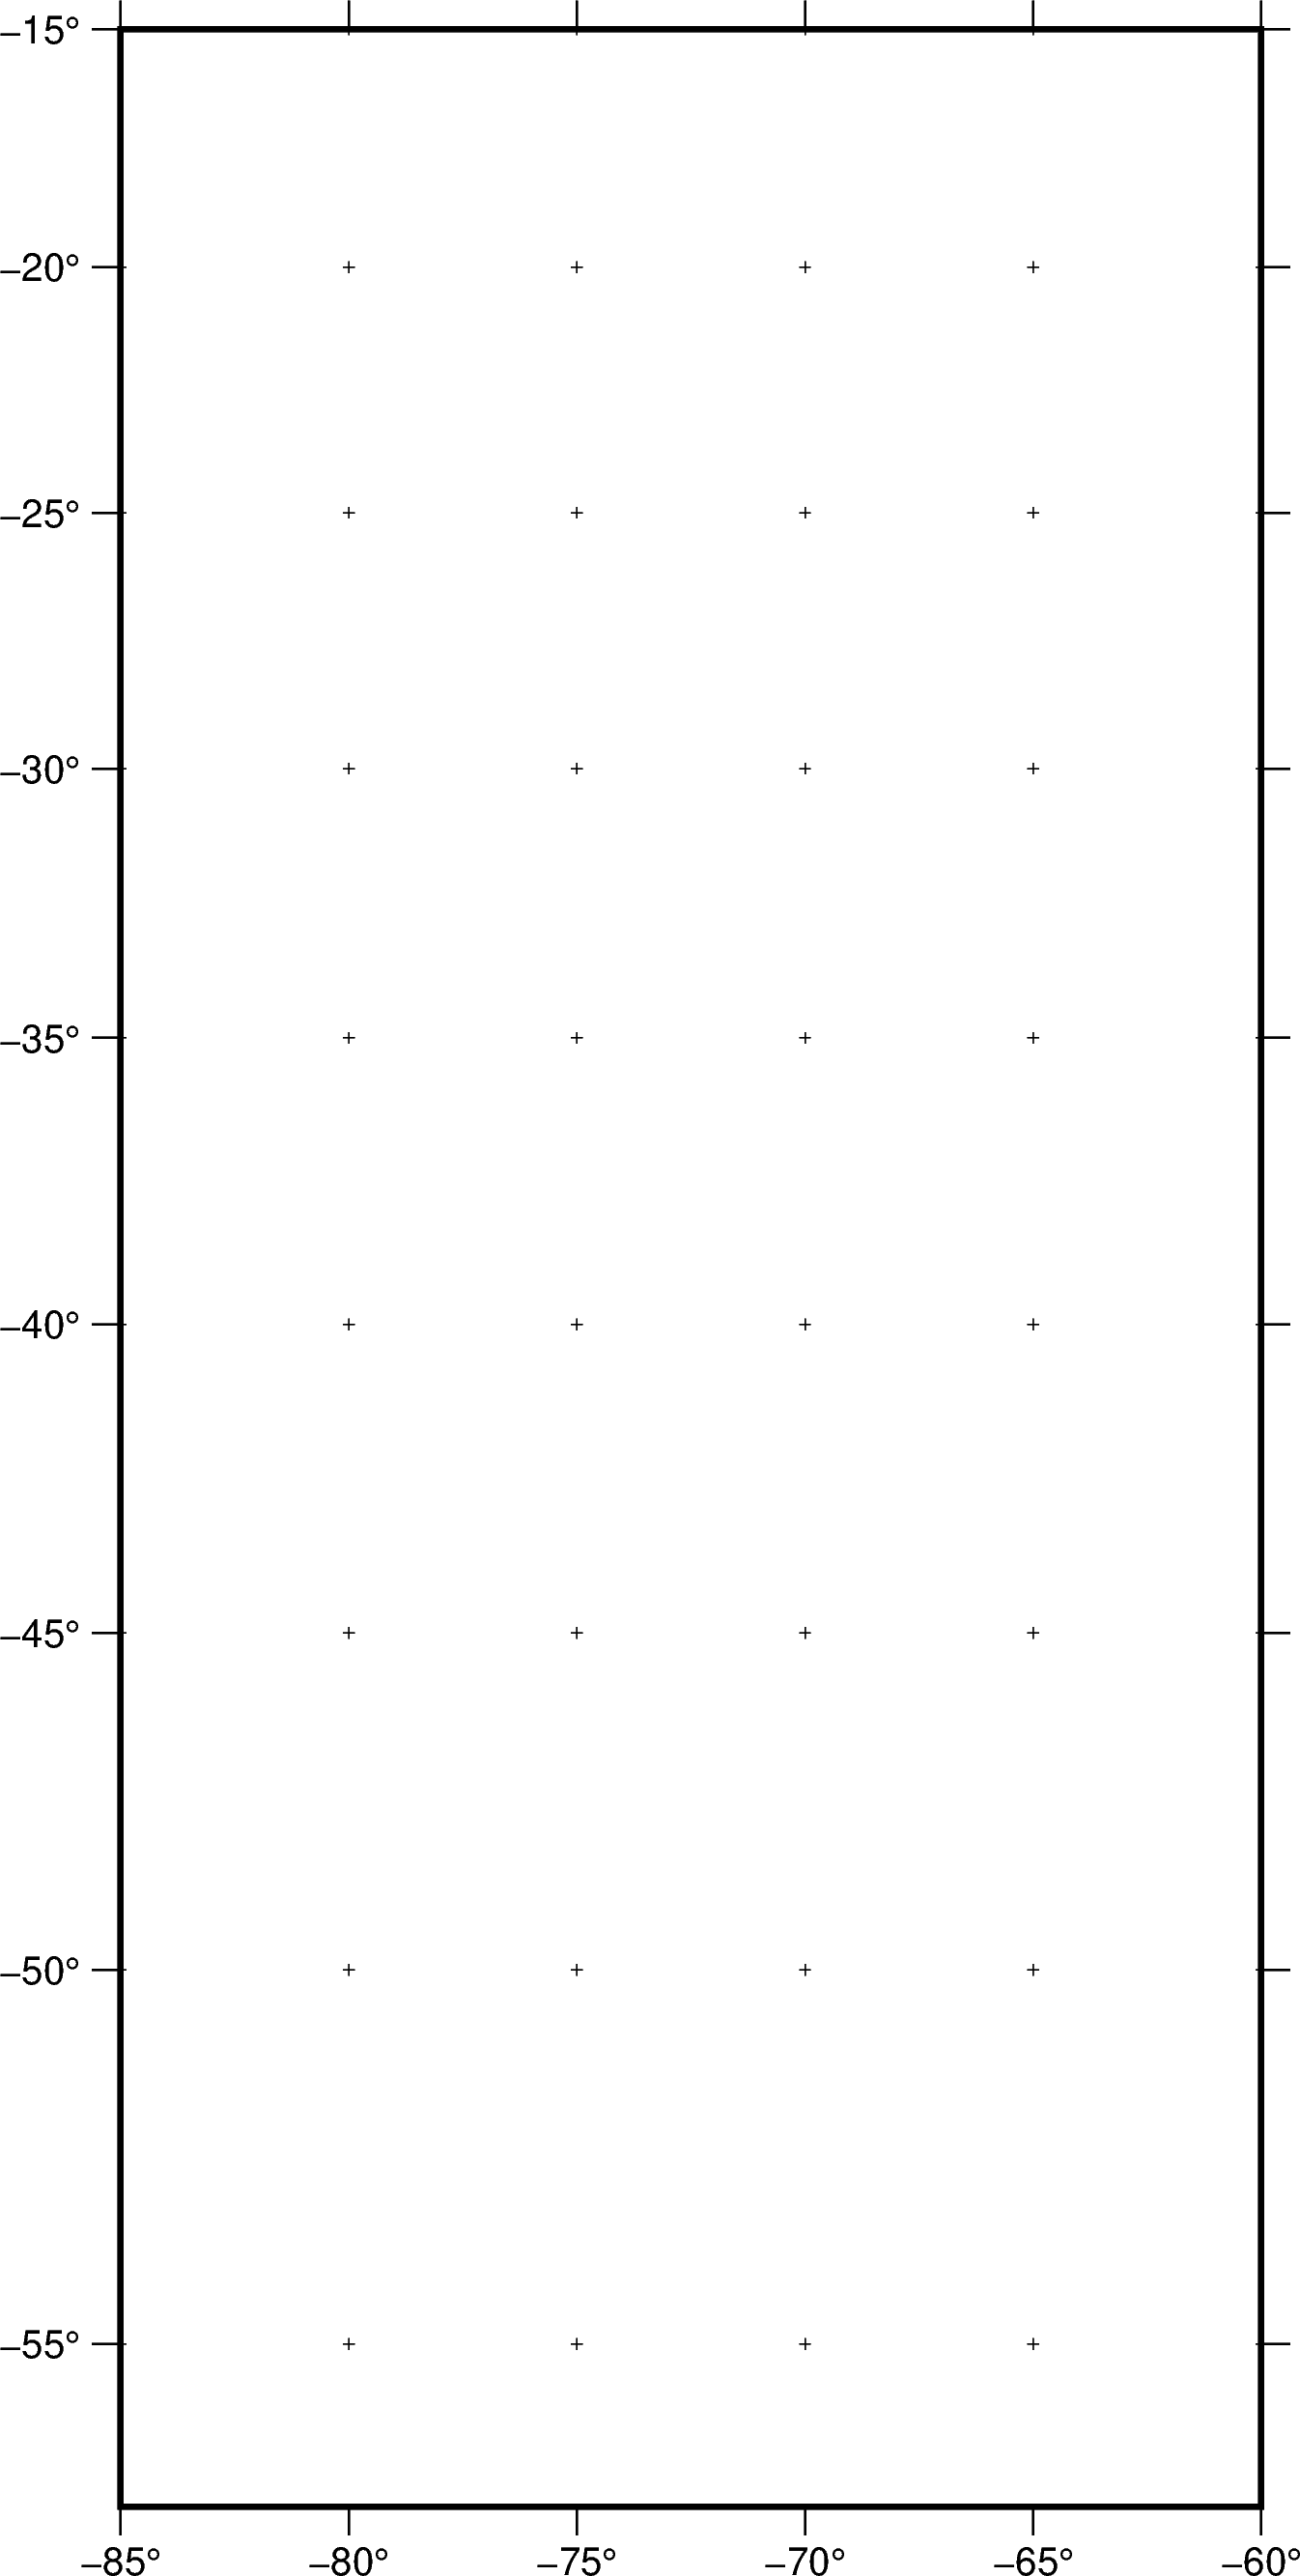
I have added a piece of script and the plot of the map.
Best regards Adrián
###### script  ######
import time
import pygmt as gmt


tia = time.process_time()
tib = time.time()


##  generación de la clase fig
fig = gmt.Figure()

gmt.config(MAP_FRAME_TYPE='plain', FORMAT_GEO_MAP='ddd',
           MAP_TICK_LENGTH_PRIMARY=0.25,
           ##MAP_TICK_LENGTH_SECONDARY=0.25,
           MAP_GRID_CROSS_SIZE_PRIMARY=0.10)


## Construcción de la base
region = [-85, -60, -57, -15]
projection = 'M10c'
fig.basemap(region=region, projection=projection, frame=['ag', 'WSne'])


##  Se muestra la figura
fig.show()

## Se genera una salida
dpi=300
show = True
fig.savefig('Test.png', show=show, dpi=dpi)

tfa = time.process_time()
tfb = time.time()
print('\n\t process_time: %5.3f (s)   time: %5.3f (s) \n' % ((tfa-tia), (tfb-tib)))


######  Figure
The secondary in the GMT configuration refers to using a primary and secondary axis (e.g., frame=["pxa6", "sxa20"]. The code that you shared only has a primary axis, so the MAP_*_SECONDARY settings do not impact the plot. Here is an example where the secondary settings apply:
fig = pygmt.Figure()
with pygmt.config(MAP_GRID_PEN_PRIMARY="1p,black,--", MAP_GRID_PEN_SECONDARY="2p,blue"):
    fig.basemap(
        region="2001-9-11T/2001-9-13T/0.01/100",
        frame=["pxa6Hf1hg6h", "pya1g3p", "sxa1Dg1D"],
        projection="X5iT/5il"
    )
fig.show()
Meghanj
Thank you for your advice about how to plot the primary and secondary axis properties.
Greetings Adrián