Pygmt grdimage fail

Data does not plot.

spd        = np.sqrt( iced.uvel.values**2 + iced.vvel.values**2 )
spd[spd>5] = np.nan
P_save     = os.path.join(D_save,"0p1","19971001_ice_speed.png")
da         = xr.DataArray(data=spd, dims=["y", "x"], coords=dict(lon=(["y","x"], np.abs(ULON)), lat=(["y","x"], ULAT)))
print(da)
print(f"min: {da.min()}")
print(f"max: {da.max()}")
fig = pygmt.Figure()
pygmt.makecpt(cmap="cmocean/speed", series=[0, 1.6, .05])
fig.coast(region=[0,360,-90,-50], projection="S0/-90/12c", frame="ag", land="gray")
fig.grdimage( grid=da, projection="S0/-90/12c", frame=["WSrt+tice speed", "xa0.1", "ya0.1"], cmap=True )
fig.show()

<xarray.DataArray (y: 2700, x: 3600)>
array([[nan, nan, nan, …, nan, nan, nan],
[nan, nan, nan, …, nan, nan, nan],
[nan, nan, nan, …, nan, nan, nan],
…,
[nan, nan, nan, …, nan, nan, nan],
[nan, nan, nan, …, nan, nan, nan],
[nan, nan, nan, …, nan, nan, nan]])
Coordinates:
lon (y, x) float64 279.9 279.8 279.7 279.6 … 80.0 80.0 80.0 80.0
lat (y, x) float64 -81.09 -81.09 -81.09 -81.09 … 65.08 65.04 64.99
Dimensions without coordinates: y, x
min: <xarray.DataArray ()>
array(0.)
max: <xarray.DataArray ()>
array(1.59320265)
makecpt [WARNING]: cmocean/speed is a discrete CPT. You can stretch it (-T/) but not interpolate it (-T//).
makecpt [WARNING]: Selecting the given range and ignoring the increment setting.
grdimage [WARNING]: Your grid y’s or latitudes appear to be outside the map region and will be skipped.
grdimage [WARNING]: No grid or image inside plot domain
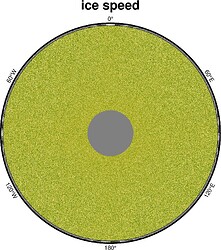
At first inspection, looks like the da’s lat values are inconsistent with your region limits

Thanks Trevor. Actually grid contains full globe. I think the problem is that GMT is inflexible when dealing with weird grids like this one – i.e. one with longitudes that go from -280 to 80. It would be nice if GMT (and by extension PyGMT) had more flexibility. For instance, I can plot this grid up in cartopy witout complaints/fail, but I prefer GMT because it is far superior, but unfortunately pretty rigid.

GMT accepts longitudes in range [-720 720], I believe.

This produces one figure

gmt grdmath -R-280/80/-60/60 -I1 -fg X Y MUL = lixo.grd
gmt grdimage lixo.grd -JX14 -Ba -jpg lixo

Your xarray.DataArray was constructed incorrectly, the lon and lat coordinates should be a 1D array instead of a mesh. Try something like this (using random data):

import numpy as np
import pygmt
import xarray as xr

spd = np.random.rand(2700, 3600)
ULON = np.linspace(start=-279.9, stop=80, num=3600)
ULAT = np.linspace(start=-81.09, stop=64.99, num=2700)
da = xr.DataArray(data=spd, dims=["y", "x"], coords=dict(x=ULON, y=ULAT))
print(da)
print(f"min: {da.min()}")
print(f"max: {da.max()}")

# %%
fig = pygmt.Figure()
pygmt.makecpt(cmap="cmocean/speed", series=[0, 1.6, 0.05])
fig.coast(region=[0, 360, -90, -50], projection="S0/-90/12c", frame="ag", land="gray")
fig.grdimage(
    grid=da,
    projection="S0/-90/12c",
    frame=["WSrt+tice speed", "xa0.1", "ya0.1"],
    cmap=True,
)
fig.show()

produces

That said, I’m not sure if it’s easy for you to modify your ULON and ULAT arrays to fit into this scheme. GMT/PyGMT should be able to plot -280/80 data as Joaquim mentioned above, and you shouldn’t need to do np.abs(ULON) (that would make the coordinates unsorted).

1 Like