Pygmt irregular grid plotting

Hello,

I am currently using Python (and associated libraries: numpy, xarray, matplotlib, cartopy, proplot) to plot the following figure.
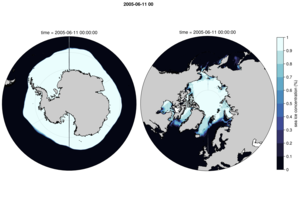
0160_resize

The issue I am facing is that it is taking roughly 90 seconds to do this. As an alternative I would like to use pygmt as it may be faster. I have used GMT and PyGMT before for figure creation and have appreciated its quality and speed. However, when I attempt to plot this grid using grdimage I run into an irregular grid problem, then when I attempt to use grd2xyz it keys on the dimensions ‘nj’ and ‘ni’ but not the coordinates. Then when I swap the ‘nj’ and ‘ni’ dimensions out to their corresponding geographic lon/lat dimensions and run through grd2xyz I get a kernel panic / crash.

Curious to hear any suggestions for a work around.

Here is the result of grdinfo:

<xarray.DataArray ‘aice_m’ (nj: 1080, ni: 1440)>
array([[nan, nan, nan, …, nan, nan, nan],
[nan, nan, nan, …, nan, nan, nan],
[nan, nan, nan, …, nan, nan, nan],
…,
[nan, nan, nan, …, nan, nan, nan],
[nan, nan, nan, …, nan, nan, nan],
[nan, nan, nan, …, nan, nan, nan]], dtype=float32)
Coordinates:
time object 2005-02-01 00:00:00
TLON (nj, ni) float32 79.88 80.12 80.38 80.62 … 80.0 80.0 80.0 80.0
TLAT (nj, ni) float32 -81.08 -81.08 -81.08 -81.08 … 65.34 65.24 65.13
ULON (nj, ni) float32 -280.0 -279.8 -279.5 -279.2 … 80.0 80.0 80.0
ULAT (nj, ni) float32 -81.02 -81.02 -81.02 -81.02 … 65.29 65.18 65.08
Dimensions without coordinates: nj, ni
Attributes:
units: 1
long_name: ice area (aggregate)
cell_measures: area: tarea
cell_methods: time: mean
time_rep: averaged
grdinfo [WARNING]: “nj”, NetCDF: Variable not found
If something bad happens later, try importing via GDAL.
grdinfo [WARNING]: “ni”, NetCDF: Variable not found
If something bad happens later, try importing via GDAL.
grdinfo [WARNING]: “d2”, NetCDF: Variable not found
If something bad happens later, try importing via GDAL.
: Title:
: Command:
: Remark:
: Pixel node registration used [Cartesian grid]
: Grid file format: nf = GMT netCDF format (32-bit float), CF-1.7
: x_min: -0.5 x_max: 1439.5 x_inc: 1 name: x n_columns: 1440
: y_min: -0.5 y_max: 1079.5 y_inc: 1 name: y n_rows: 1080
: v_min: 0 v_max: 0.999973714352 name: z
: scale_factor: 1 add_offset: 0
: format: classic
: Default CPT:

da              = xr.load_dataset('./iceh.2005-01.nc',chunks=None).aice_m.isel(time=0)
da['longitude'] = xr.DataArray(data=da.TLON.data[0,:],dims='ni').set_index()
da['latitude']  = xr.DataArray(data=da.TLAT.data[:,0],dims='nj').set_index()
da              = da.drop(['ULAT','ULON','TLON','TLAT'])
#da              = da.swap_dims({'nj':'latitude','ni':'longitude'})
print(da)
print(pygmt.grdinfo(grid=da))
fig = pygmt.Figure()
fig.coast(region = [0, 360, -90, -50], projection = "S0.0/-90.0/50/5i", shorelines = True)
fig.basemap(frame = ["a", "WSNE"])
#xyz = pygmt.grd2xyz(grid=da)
fig.grdimage(grid=da,cmap= "haxby",frame=True)
fig.show()
I have a solution (well half-hemisphere solution!):

   g = pygmt.nearneighbor(x=np.ravel(ice.TLON.data),
                       y=np.ravel(ice.TLAT.data),
                       z=np.ravel(ice.data),
                       region=region,
                       spacing=spacing,
                       search_radius=search_radius)
fig = pygmt.Figure()
fig.basemap(region=region, projection=projection, frame=["ag", tit_str])
fig.grdimage(g,cmap=cmap)
fig.colorbar(frame="af+l{:s}".format(cbar_lab))
fig.coast(land='brown')
fig.show()
fig.savefig(F_out)

OK, almost there, but a nudge from someone would be most appreciated.

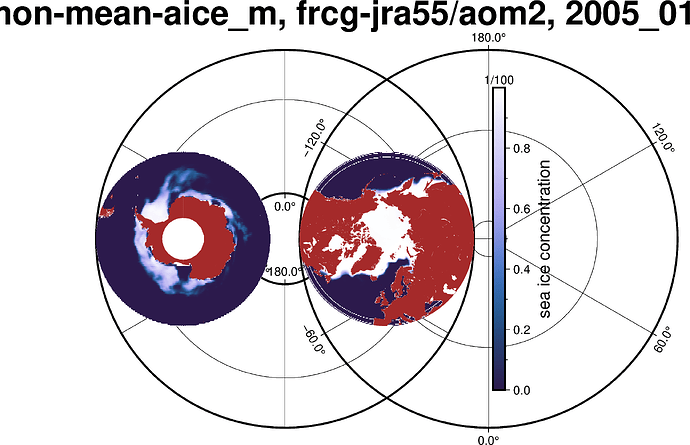
Here is my latest plot:

Does someone have a suggestion to get my subplots to line up?

I get this with the following code:

fig = pygmt.Figure()
pygmt.config(FORMAT_GEO_MAP="ddd.x", MAP_FRAME_TYPE="plain")
if both_hemis:
    tit_str = 'CICE6 {ms:s}-{vn:s}, frcg-{af:s}/{of:s}, {dt:s}'.format(af=atm_frcg,of=ocn_frcg,ms=mean_str,vn=var_name,dt=dt_str)  
    with fig.subplot(nrows=1, ncols=2, title=tit_str, figsize=("10c","10c")): 
        with fig.set_panel(panel=0):
            region=[0,360,-80,-50]
            projection="S0/-90/10c"
            print(f'southern hemisphere nearestest neighbour for GMT regular grid requirement {(time.process_time()-c0):.3f}')
            g = pygmt.nearneighbor(x=np.ravel(ice.TLON.data),
                                y=np.ravel(ice.TLAT.data),
                                z=np.ravel(ice.data),
                                region=region,
                                spacing=spacing,
                                search_radius=search_radius)
            fig.basemap(region=region, projection=projection, frame="ag")
            fig.grdimage(g,cmap=cmap)
            fig.coast(land='brown')
        with fig.set_panel(panel=1):
            #fig.shift_origin(xshift="w+0.5c")
            region=[0,360,40,90]
            projection="S0/90/10c"
            print(f'northern hemisphere nearestest neighbour for GMT regular grid requirement {(time.process_time()-c0):.3f}')
            g = pygmt.nearneighbor(x=np.ravel(ice.TLON.data),
                                y=np.ravel(ice.TLAT.data),
                                z=np.ravel(ice.data),
                                region=region,
                                spacing=spacing,
                                search_radius=search_radius)
            
            fig.basemap(region=region, projection=projection, frame="ag")
            fig.grdimage(g,cmap=cmap)
            fig.coast(land='brown')
            fig.colorbar(frame=[f"x+l{cbar_lab}", f"y+l{cbar_units}"], position="JMR+o0.5c/0c+w8c")
else:
    print(f'southern hemisphere nearestest neighbour for GMT regular grid requirement {(time.process_time()-c0):.3f}')
    g = pygmt.nearneighbor(x=np.ravel(ice.TLON.data),
                        y=np.ravel(ice.TLAT.data),
                        z=np.ravel(ice.data),
                        region=region,
                        spacing=spacing,
                        search_radius=search_radius)
    tit_str = 'tCICE6 {ms:s}-{vn:s}, frcg-{af:s}/{of:s}, {dt:s}'.format(af=atm_frcg,of=ocn_frcg,ms=mean_str,vn=var_name,dt=dt_str) 
    fig.basemap(region=region, projection=projection, frame=["ag", tit_str])
    fig.grdimage(g,cmap=cmap)
    fig.colorbar(frame="af+l{:s}".format(cbar_lab))
    fig.coast(land='brown')
fig.show()
fig.savefig(F_out)
print(f'saved figure to {F_out}\n {(time.process_time()-c0):.3f}')

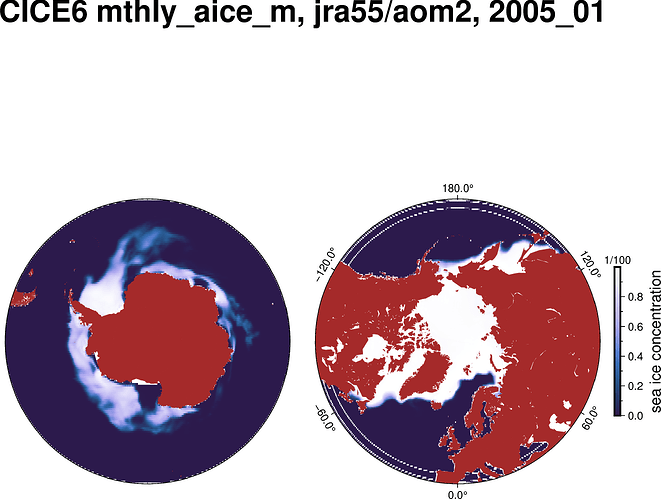
Hello @dpath2o,

in subplot mode, you have to use a ? for the size of the map or projection, i.e., projection="S0/90/?".

Hi Yvonne,

Bingo! A bit of white space that I’ll spend far too many hours trying to get rid of, but this will work for now.

Cheers,
Dan