# Lateral extent (degrees)
lon_min = -132
lon_max = -100
lat_min = 28.5
lat_max = 52.5
# Arc-length increment (degrees)
dlonlat = 0.1

# East-West Cross-Section, constant lat
lat_xsec = 40

arc_min = lon_min
arc_max = lon_max
arc_length = lon_max - lon_min
arc_midpoint = lon_min + arc_length/2
nlon = int( abs(lon_max - lon_min)/dlonlat ) + 1
lon = np.linspace(lon_min, lon_max, nlon)
print("arc_min, arc_max, arc_midpoint: ", arc_min, arc_max, arc_midpoint)
lat = np.linspace(lat_xsec, lat_xsec, nlon)

# Depths (meters)
dep_min = 0
dep_max = 400e3
ddep = 10e3
ndep = int( (dep_max - dep_min)/ddep ) + 1
dep = np.linspace(dep_min, dep_max, ndep)

# Define the xarray for data points
ds_points = xr.Dataset(
    coords={
        "latitude":lat,
        "longitude":lon,
        "depth":dep
    },
    attrs={"radius_in_meters":6371e3}
)
ds_points

# Get the mesh for a specific model

# Starting Model 50-120 seconds
inv_config_name = "inversion_0a"
it = 0

# Current Model
inv_config_name = "inversion_5a"
it = 27

# Build model name
model_name = inv_config_name+"_it_"+str(it).rjust(2,'0')

print('inv_config_name: ', inv_config_name)
inv = p.entities.get(
    entity_type='inverse_problem_configuration',
    entity_name=inv_config_name
)
sim_name = p.inversions.get_simulation_name(
                inverse_problem_configuration=inv_config_name,
                iteration_id=it
)
print(it, sim_name)
mesh = p.simulations.get_mesh(sim_name)
#mesh

# Extract model at ds_points
print('... extracting dataset from mesh ...')
ds = umu.extract_model_to_regular_grid(mesh, ds_points, ["VSV", "VSH"])
ds

# Reduce dataset to 2D, select only and then drop latitude
ds2d = ds.isel(latitude=0)
ds2d = ds2d.drop(labels="latitude")
# Convert depth to km
ds2d = ds2d.assign_coords(depth=ds2d['depth']/1000)

print('... computing Voight-average and eta on dataset ...')
# Compute Voight-averaged isotropic VS & XS, drop VSV & VSH
ds2d = ds2d.assign(VS = np.sqrt( (2 * (ds2d["VSV"]**2) + ds2d["VSH"]**2) / 3 ) )
ds2d = ds2d.assign(XS = (ds2d["VSH"] / ds2d["VSV"] )**2 )
ds2d = ds2d.drop_vars(["VSV", "VSH"])

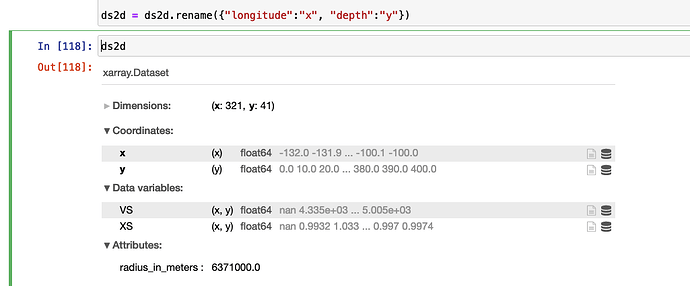
ds2d = ds2d.rename({"longitude":"x", "depth":"y"})

print(ds2d)
ds2d['VS'].to_netcdf("ds2d_vs.nc")

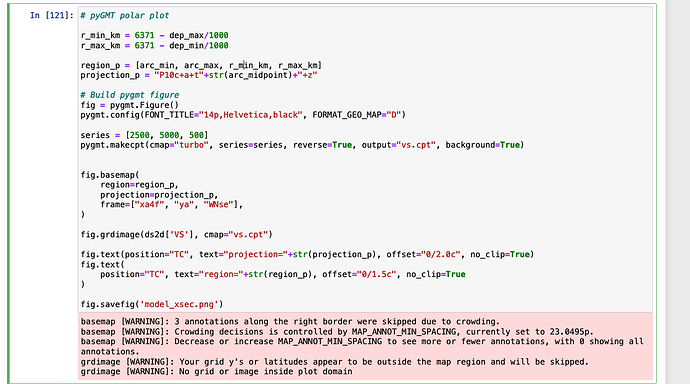
# pyGMT polar plot

r_min_km = 6371 - dep_max/1000
r_max_km = 6371 - dep_min/1000

region_p = [arc_min, arc_max, r_min_km, r_max_km]
projection_p = "P10c+a+t"+str(arc_midpoint)+"+z"

# Build pygmt figure
fig = pygmt.Figure()
pygmt.config(FONT_TITLE="14p,Helvetica,black", FORMAT_GEO_MAP="D")

series = [2500, 5000, 500]
pygmt.makecpt(cmap="turbo", series=series, reverse=True, output="vs.cpt", background=True)


fig.basemap(
    region=region_p,
    projection=projection_p,
    frame=["xa4f", "ya", "WNse"],
)

fig.grdimage(ds2d['VS'], cmap="vs.cpt")

fig.text(position="TC", text="projection="+str(projection_p), offset="0/2.0c", no_clip=True)
fig.text(
    position="TC", text="region="+str(region_p), offset="0/1.5c", no_clip=True
)

fig.savefig('model_xsec.png')


