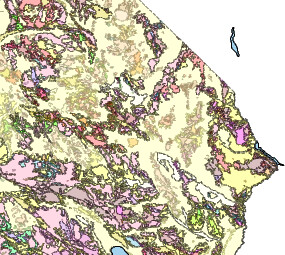
Hello again! After successfully plotting and coloring a large number of polygons as per my previous post, I’ve discovered that many of the polygons are being plotted over by other polygons. I suspect that this may be due to PyGMT not respecting the holes? From what I’ve read, it’s been suggested to mark the holes manually. However, I have far to many polygons to correct them by hand. Is there a way to make PyGMT plot the polygons as I wish it to?
My code for plotting the polygons:
import geopandas as gpd
import pygmt
import pandas as pd
import fiona
import os

main_dir = r'C:\Users\USER\Desktop\testing'

# Geologic bed polygons gmt file path
polyData = os.path.join(main_dir,'Data', 'GMC_geo_poly.gmt')

# Geologic bed cpt file path
polyColor = os.path.join(main_dir,'Data', 'geo_poly_color.cpt')

# Map save file path
saveName = os.path.join(main_dir, 'Results', 'geologic_map.png')

# Parameters
region = [-125, -122, 38, 40]

fig = pygmt.Figure()

fig.basemap(
    region = region,
    projection = 'M6i',
    frame = 'f'
    )

# plots the polygons from the gmt file
fig.plot(
    data = polyData,
    pen="0.1p,black,-",  # set outline colour
    cmap = polyColor,
    color = '+z',
    #verbose=True,
    close=True,  # force close polygons
    aspatial='Z=Name',
    transparency = 50
    )

fig.coast(
    shorelines = '0.1p,black',
    resolution = 'h',
    water = 'lightskyblue2',
    #transparency = 50,
    )

# saves a copy of the generated figure
fig.savefig(saveName)
An example of part of the map with excessive plotting over holes (holes are fainter in color because I set transparency on, as normally they would be completely obscured):
