Hi there,
I have to switch to Python(3) using VSCode in Interactive mode for my work and I’m having quite a hard time with figures. I’ve worked on a small exercise in which I simply plot stations.
For this I got a geojson file with
index | on/off | name | number | geometry   | area
0     |   0    |  bla |   0    | POINT(x,y) | zone_1
1     |   0    |  ble |   1    | POINT(x,y) | zone_1
...
128   |   1    |  bly |   64   | POINT(x,y) | zone_8
So far, the cleanest code I have to display those stations is
import plotly as px
import geopandas as gpd

data = gpd.read_file(file)
fig=px.scatter(data,
		x=data["geometry"].values.x,
		y=data["geometry"].values.y,
		color="area",
		symbol="on/off")

fig.show(renderer="browser") #for the external window
It’s nice, interactive and all … But I’m not satisfied because I don’t have a map in the background.
I’ve tried a little bit to play with folium, geopandas.plot and such… but it’s convoluted and not necessarily what I’m looking for.
ANYWAY ! Back to GMT, or should I say PyGMT !
-
First question:
Is there a way to achieve what I’ve done just above without adding too many variables (I try to avoid `x=data[“this”] ; x2 = x[“that”] ; so on …)? -
Second question:
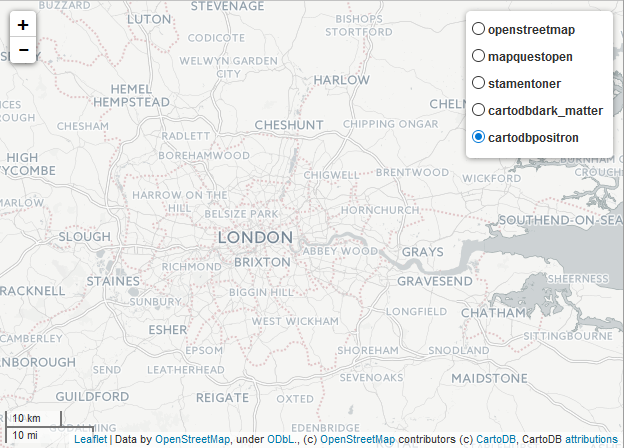
Can I add a background such asCartoDB positronor OpenStreetMap ?
What I’ve done with PyGMT is :
fig.basemap(region=region,
			projection="M12c",
			frame=["af", f'WSen+t"{title}"'])

fig.coast(land="gray",
		  water="lightblue",
		  shorelines="thinner,black")

fig.plot(x=data2["geometry"].values.x,
		 y=data2["geometry"].values.y,
		 style="c0.3c",
		 color="red")
But of course, it’s not as nice like this.
Thanks,
Guillaume
