k1989
May 11, 2022, 3:06pm
1
Hi there,
Using the following xyz file xyz_example.txt (165 Bytes) and the two following commands:
awk '{print $1, 6370-$2, $3}' xyz_example.txt| gmt surface -R0/5/6280/6370 -I5m/10k -Gt.nc

gmt grdimage t.nc -Baf -B+t -R0/5/6280/6370  -JPa30z -pdf cross_section
I am able to create a cross-section that looks like that:cross_section.pdf (8.0 KB)
I was wondering whether there is a way to make the grids follow the curvature of the plot’s frame (so there are no gaps in the plot’s edges).
Just pick smaller gridding increments until it does not bother you anymore, e.g., -I1m/1
Have you try selecting a region (in surface) slightly bigger than the one use for grdimage?
Use -R0/6/6270/6380
awk '{print $1, 6370-$2, $3}' xyz_example.txt| gmt surface -R0/6/6270/6380 -I5m/10k -Gt.nc
gmt grdimage t.nc -Baf -B+t -R0/5/6280/6370  -JPa30z -png cross_section
k1989
May 12, 2022, 6:52am
5
Thanks a lot for the help!
awk '{print $1, 6370-$2, $3}' xyz_example.txt| gmt xyz2grd -R0/5/6280/6370 -I50m/20k -Gt.nc
gmt grdimage t.nc -Baf -B+t -R0/5/6280/6370  -JPa30z  -png cross_section
That gives the following:
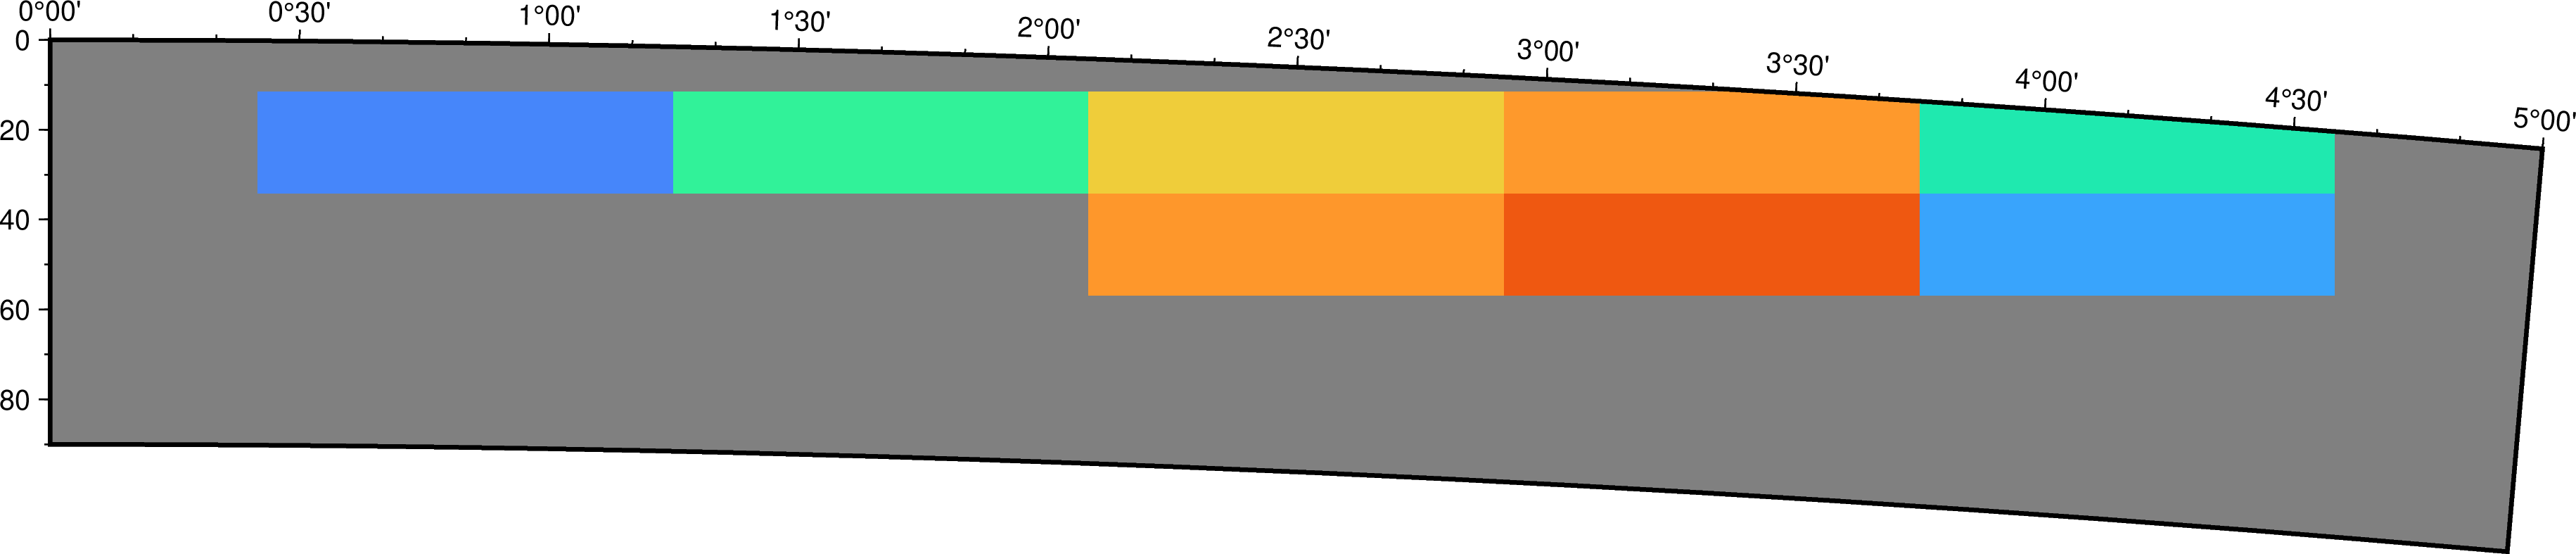
I was wondering if there is a way to plot the grids/cells looking something like the image below?
You would need grdview -T for that.
Unfortunately grdview -T has a bug if -C is not given so you will need to create a CPT and pass it via -C for this to work until the bug fix is merged ( I just submitted a PR).
k1989
May 12, 2022, 9:24am
8
Thanks again, grdview -T works great!