Hi everyone,
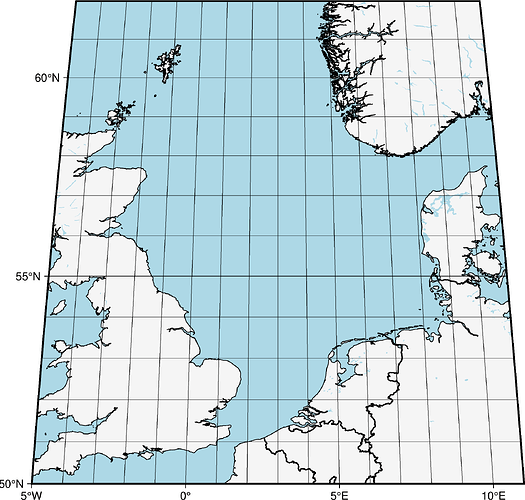
I’m working on plotting a map of the North Sea using the Mollweide projection, and this code works perfectly for generating a map:
import pygmt

fig = pygmt.Figure()

fig.basemap(projection='W15c', region='-5/11/50/62', frame='a')

fig.coast(
    shorelines="1/0.5p",
    borders=["1/thick,black", "2/thin,black@40"],
    water="lightblue",
    land="whitesmoke", frame="g")

fig.show()
This generates the following figure:
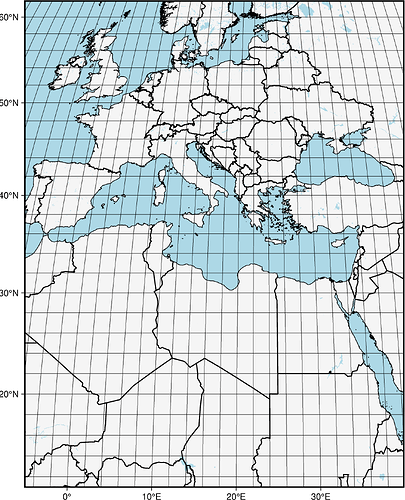
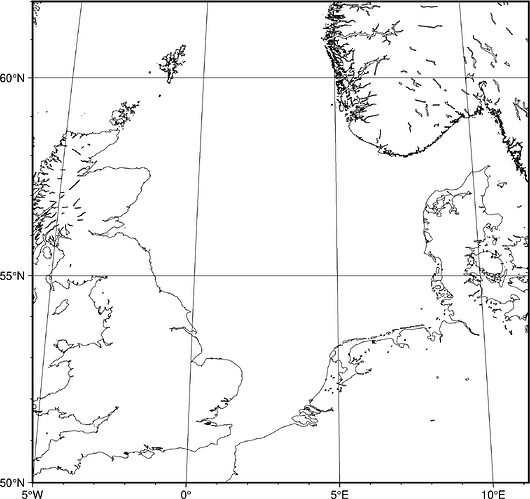
However, I’m aiming to have the borders straight (not inclined due to the projection). I assumed that using the +r option in the region argument would make the borders straight while keeping the gridlines inclined. But when I try this, I get the following result:
This is the code for replication:
import pygmt

fig = pygmt.Figure()

fig.basemap(projection='W15c', region='-5/11/50/62', frame='a')

fig.coast(
    shorelines="1/0.5p",
    borders=["1/thick,black", "2/thin,black@40"],
    water="lightblue",
    land="whitesmoke", frame="g")

fig.show()
Although the borders are straight, the region expanded significantly, affecting the visualization that was supposed to focus on the North Sea.
Has anyone encountered this issue or know how to make the borders straight while using the Mollweide projection?
Thanks in advance!


