Hello,
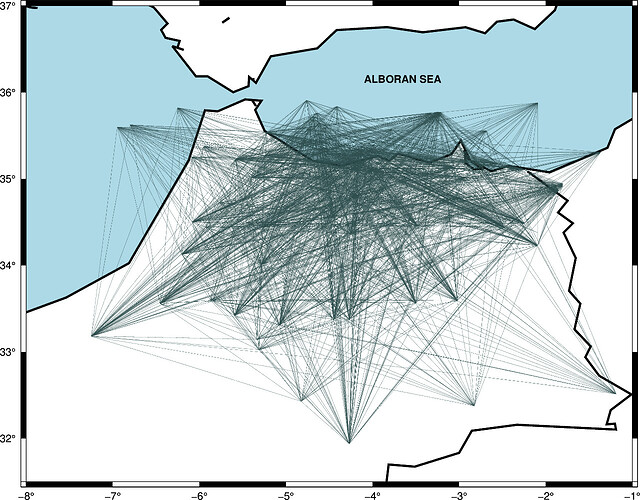
I creat a ray paths coverage using GMT script. The output file of my script is Ps file.
When I convert the Ps format to the Pdf format or Jpg format the ray paths disapper.
Please see the attachment files (one of the picture is only screenshot on my laptop)
Is there any why to have a pdf format in the output?
Could you please help me to fix this probelm?
Best Regards
Hello Boulanouar! It would be helpful if you could share your script (or a simplified version that produce the same error). And maybe also a small dataset.
Thank you so much Esteban82, Here it is the code that I used
draw lines (ray paths)
gmt psxy -R -J -B -O -K -m -GSlategray >> $outputfile << END
-5.311 33.023
-6.454 33.558
-5.311 33.023
-5.582 35.225
-5.311 33.023
-6.081 34.500
-5.311 33.023
-5.403 35.015
gv -orientation=LANDSCAPE $outputfile
One possible cause is: in your last command, you should use -O only, not -K -O.
Exactly, the problem is solved by adding -W command
Hi, I am trying to do something like this. I have 20 stations with their locations and I am trying to plot their raypath coverage using pygmt. I computed the coordinates of inter-station pairs, I can plot the coordinates on a plot but to plot them with a loop on a pygmt map, it is a problem for me. In online forums i have seen people creating a file.geo that has all the coordinates, but I do not know how to create it from my available points. How do i do this more efficiently? I would appreciate if anyone shares a code with me or guides me on how to do it

