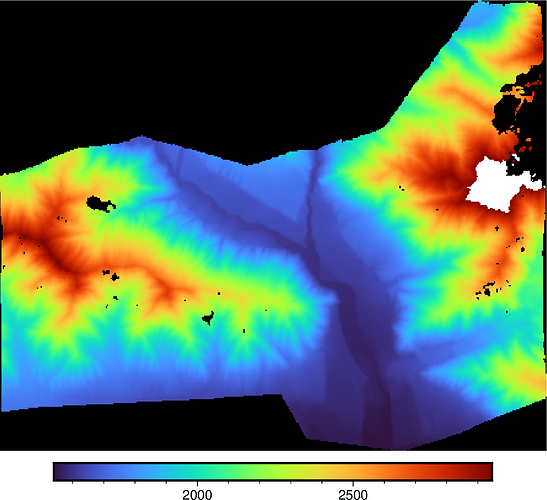
Hi there, sorry if this ends up being super basic. I’m trying to display this DEM (downsampled from original for upload) in order to do some swath profiling of fault scarps, in a similar way to example 33.
I’m currently unable to load my DEM, and get this output. The geographic ranges look good
grdimage [INFORMATION]: File dem-DEM_aligned_30m.tif reads with GDAL driver GTiff
grdimage [INFORMATION]: Read header from file dem-DEM_aligned_30m.tif
grdimage [INFORMATION]: File dem-DEM_aligned_30m.tif reads with GDAL driver GTiff
grdimage [INFORMATION]: gmt_map_setup perimeter search region: 70.65900000010298/71.03100000019242/39.05132776178719/39.36768301479938.
grdimage [INFORMATION]: Map scale is 0.730022 km per cm or 1:73002.2.
grdimage [INFORMATION]: Allocate and read data from file dem-DEM_aligned_30m.tif
grdimage (gmtapi_import_grid): Subset x range <= 0.0
[Session gmt (0)]: Error returned from GMT API: GMT_RUNTIME_ERROR (79)
[Session gmt (0)]: Error returned from GMT API: GMT_RUNTIME_ERROR (79)
[Session gmt (0)]: Error returned from GMT API: GMT_RUNTIME_ERROR (79)
psconvert [ERROR]: Unable to decode BoundingBox file /home/bwwj/.gmt/sessions/gmt_session.7279/psconvert_7344c.bb (maybe no non-white features were plotted?)
Here’s the file: dem-DEM_aligned_30m.tif (434.7 KB)
Here’s the code:
#!/bin/bash
gmt gmtset FORMAT_GEO_MAP D:mm
echo “testing loading tif in gmt”
im=“dem-DEM_aligned_30m”
proj=“-JU42/20c”
bounds=“-R70.759/39.154/70.931/39.265+r”
# downsample
# gdalwarp -r average -tr 30 30 -multi -wo NUM_THREADS=ALL_CPUS -co BLOCKXSIZE=256 -co BLOCKYSIZE=256 -co TILED=YES -co NUM_THREADS=ALL_CPUS -co COMPRESS=LZW dem-DEM_aligned.tif dem-DEM_aligned_30m.tif
gmt begin test
- gmt makecpt -Cdem1 -T1000/3000/50 -Z*
- gmt grdimage ${im}.tif $bounds $proj -V #-I${im}.int -Bxa0.05f0.01 -Bya0.05f0.01*
gmt end show
