Hello,
I am trying to calculate the mean sea surface values using Sentinel 3 data. I have exported the netcdf files from BRAT software. I want to display them using the GMT6 software but am facing some issues. Specifically, the netcdf files have been successfully imported in GMT but when am trying to display them through the “gmt grdimage” command the image seems to be rotated. Can you help me with this?
Thank you in advance,
Marina
What do you mean by rotated? Transposed?
grdimge is showing you what’s in the file. Maybe you should try to use those Sentinel 3 nc files directly instead of converting them first.
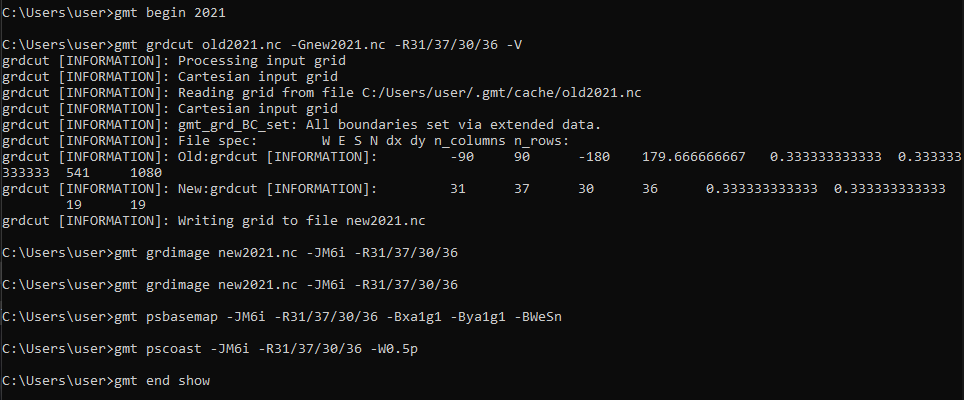
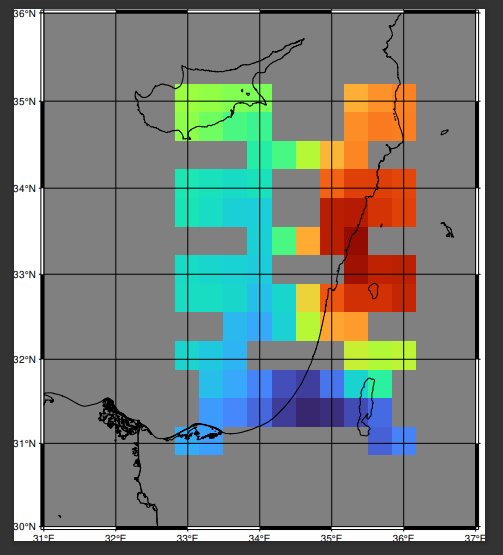
I attached the map to understand what I mean about the rotation. I want to display the netcdf file above Cyprus and on the next step i want to interpolate the gaps.
I dont understand what is wrong with the necdf file.
Thank you.
I see no rotation and also we can’t tell if there is anything wrong with the file. Just that it’s too coarse for the area being represented.
And please, try to avoid screen-captures (hard to read).
BlockquoteC:\Users\user>gmt grdfill 2018_3_r.nc -R29/37/30/38 -Ac -G2018_int.nc
grdfill [ERROR]: Subset exceeds data domain!
Does anyone know about this error?
Means that -R29/37/30/38 exceeds data domain. You must set a -R (region) that does not exceed the data limits (grid limits).
Thank you very much mr.Joaquim. I have another question. Did you know how to cut the values of coastline from my metcdf? Do i need another file with the coastline of Cyprus? I attached my script.
Blockquotegmt begin 2018
gmt grdcut 2018.nc -R29/37/30/38 -G2018_cut.nc
gmt grdedit 2018_1_r.nc -R29/37/30/38 -Ee -G2018_2_r.nc
gmt grdedit 2018_2_r.nc -R29/37/30/38 -Ev -G2018_3_r.nc
gmt grdfill 2018_3_r.nc -Lp -Ginter_2018.nc
gmt grdcut inter_2018.nc -Gclip_2018.nc -R31/35/34/36 -JM5c -V
gmt grdimage clip_2018.nc -R31/35/34/36 -JM5c
gmt psbasemap -R31/35/34/36 -Bxa1g1 -Bya1g1 -BWeSn -JM5c
gmt pscoast -R31/35/34/36 -W0.5p -G"225/200/175"
gmt colorbar -C
gmt psscale -Dx6.5i+jLM/2i+w7.5c/1.25c+e -O -C -I -Bx5+l"Mean Sea Level" -By+lm
gmt psxy palli.xy -JM5c -R31/35/34/36 -W0.5p -Gblue -Sc0.03i
gmt end show
Marina, not sure I understand your question. Are you looking for grdlandmask?
Goodmorning mr. Joaquim. I tried the grdlandmask. I create the final map from the above scprit. I atteched you the result.
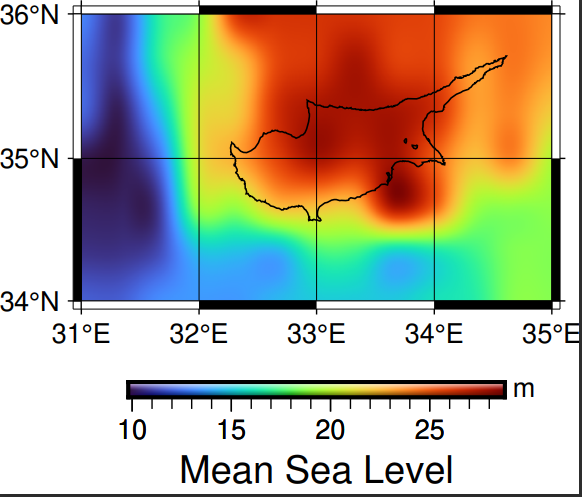
So, now i want to clip from my netcdf file the coastal and land area of Cyprus. I tried with the grdlandmask, grdclip and i can’t do it.
Can you help me please?
To apply the result of grdlandmask, that presumably have NaN over land, you multiply it with the mean sea level grid using grdmath. Something like
gmt grdmath sealevel_grid mask_grid MUL = result.grd
Thank you very much for your help!