Hello everyone,
I hope you’re all doing well. I am reaching out for some assistance with customizing the GMT color palette table (CPT) for ETOPO1 data and adding a hillshade effect. I have been trying to create a specific visualization based on this data, and I’m struggling to achieve the desired output. I’ve attached an image of the final result I’m aiming for below.
I’ve been referencing the following article to help me in my endeavor: [Symbolizing ETOPO1 Data]
Here’s what I’ve done so far:
- I’ve downloaded the ETOPO1 data.
- I’ve tried to modify the default CPT for ETOPO1, but I’m not sure how to create the exact color scheme I’m aiming for.
- I’d like to add a hillshade effect to the final map for a more realistic representation of the terrain.
I would highly appreciate any guidance or suggestions on how to modify the GMT CPT for ETOPO1 and add a hillshade effect to achieve the desired result. If you have any relevant resources, tutorials, or examples to share, please do.
Thank you in advance for your help!
GMT comes with better data than etopo1 (@earth_relief_15s for instance) but you are of course welcome to use that old data set.
Hillshade is simply done by adding -I to grdimage (read about modifiers).
Cannot help you with customising a CPT since I have no idea what you actually want to change.
The folks who gets the best help supply a working script that shows what they are trying.
Thanks for your reply, I downloaded the earth_relief_15s dataset and tried to generate an image using my own converted CPT file. However, the resulting image appears to have errors, and I suspect the issue lies in the conversion of the ArcGIS Colormap file to the GMT CPT file.
Below is the code I used for the conversion, as well as the original Colormap file and the converted CPT file. Could anyone help me identify any potential issues with the conversion process?
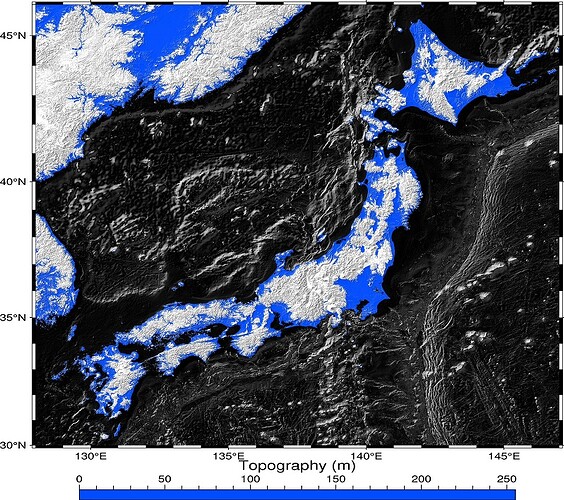
Additionally, I am attaching the GMT script I used to create the image and the resulting image itself.
Conversion Code:
def arcgis_to_gmt_cpt(input_file, output_file):
    with open(input_file, 'r') as clr_file, open(output_file, 'w') as cpt_file:
        cpt_file.write('# Color palette table converted from ArcGIS colormap\n')
        cpt_file.write('# value\tred\tgreen\tblue\n')

        previous_line = None
        for line in clr_file:
            if line.startswith('#') or not line.strip():
                continue

            tokens = line.strip().split()
            if len(tokens) != 4:
                print(f"Skipping line: {line.strip()}")
                continue

            value, red, green, blue = tokens

            if previous_line:
                cpt_file.write(f"{previous_line[0]}\t{previous_line[1]}\t{previous_line[2]}\t{previous_line[3]}\t{value}\t{red}\t{green}\t{blue}\n")
            previous_line = (value, red, green, blue)

        cpt_file.write(f"{previous_line[0]}\t{previous_line[1]}\t{previous_line[2]}\t{previous_line[3]}\n")

if __name__ == "__main__":

    arcgis_to_gmt_cpt("etopo1_arcgis.clr", "etopo1_arcgis_gmt.cpt")
Original ArcGIS Colormap File and Converted GMT CPT File:
etopo1_arcgis_gmt.zip (111.0 KB)
GMT Script:
@echo off
setlocal
set GMT_SESSION_NAME=%RANDOM%

gmt begin japan_map_custom_etopo1 pdf
gmt coast -R128/147/30/46 -JM6i -Baf -Ggray
gmt grdimage @earth_relief_15s -I -CD:/GMTDB/etopo1_arcgis_gmt.cpt
gmt colorbar -CD:/GMTDB/etopo1_arcgis_gmt.cpt -DjCB+w5i/0.15i+h+o0/-0.8i -Bx+l"Topography (m)" --MAP_FRAME_PEN=0.5p
gmt end show

endlocal
Resulting Image:
I appreciate any guidance on this issue. Thank you!
Best regards,
Well, that dumb arc colour-table with > 21k entries starts at elevation = 0 so of course the oceans will be background color (black). Presumably you will need to start z at -10500 or whatever the min is supposed to be. Then it goes meter by meter until the last record which misses the max entry and sets that to 255 (the red value) instead. I have modified the read check to give an error if max <= min now - it was only a check for min == max that gave an error. So the modified code would have stated
colorbar [ERROR]: Z-slice around line 20999 with dz <= 0
which would have at least pointed out the error (that is why your plotted CPT bar only goes 0-255).
If you fix that last record in the CPT and start it from -10500 (or whatever) then you can plot. However, my advise would be to throw the arc CPT in the toilet and use a reasonable one from the GMT list that seems similar to your desired map, for instance the etopo1 CPT  After all, that is the original CPT from NOAA.
First of all, I’d like to express my sincere gratitude for your help with this issue! Your suggestions have been invaluable to me.
Now, I have a question regarding the ETOPO1 CPT file. I’d like to modify the ETOPO1 CPT file to set the color for values greater than 0 to “transparent” (i.e., not displayed). Could you please advise me on how to achieve this effect? I look forward to your response, and once again, thank you for your assistance!
Many options. If it must be transparent then only this will do it
- use grdclip on the global grid to set all positive heights to NaN
- Add -Q to grdimage to make NaNs transparent
Unless you are making a 2x1 meter wall map I would do this on a lower resolution since you cannot tell the difference on a page sized plot. Play with @earth_relief_01d until you got the transition correct, then use maybe 2m resolution?
Note that your original image on top is not transparent. It only has the CPT truncated to sea level and then set the Foreground color to light grey. You can see the grey various with hillside there. The above will make it transparent. If you want to just grab and no hillside you might as well just plot with coast on top and mask out the land,
Hi there,
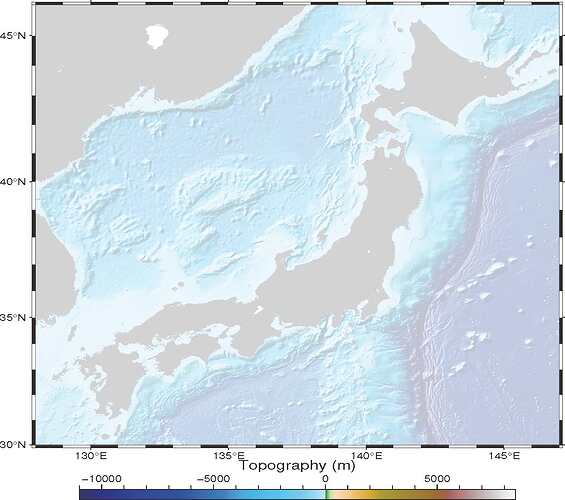
Thank you for your response! I’ve followed your suggestions, and it did show some improvement, but it’s still not perfect. I checked multiple times, but I couldn’t figure out where the problem lies. I’ve included the script and the relevant images below. Could you please help me identify the issue? I really appreciate your help!
the main issue seems to be that the underwater section (where the height is greater than 0) appears to be covered by a layer of fog. Additionally, some parts are missing hillside features.
@echo off
setlocal
set GMT_SESSION_NAME=%RANDOM%

:: Step 1: Clip the grid to set positive heights to NaN
gmt grdclip @earth_relief_01m -Gclipped_grid.nc -Sa0/NaN

gmt begin japan_map_etopo1 pdf
gmt coast -R128/147/30/46 -JM6i -Baf -Ggray

:: Step 2: Add -Q and use the clipped grid in grdimage
gmt grdimage clipped_grid.nc -I -Cetopo1 -Q -t70

gmt colorbar -Cetopo1 -DjCB+w5i/0.15i+h+o0/-0.8i -Bx+l"Topography (m)" --MAP_FRAME_PEN=0.5p
gmt end show

:: Clean up the clipped grid file
del clipped_grid.nc

endlocal
Looking forward to your reply. Thanks in advance!
This is due to -t70 in step 2. Try to remove it to see if you can get what you want.
thanks for your reply, but some parts (where the height is greater than 0) missing hillside features, how can I fix it
Sorry, I don’t think if I understand what you want.
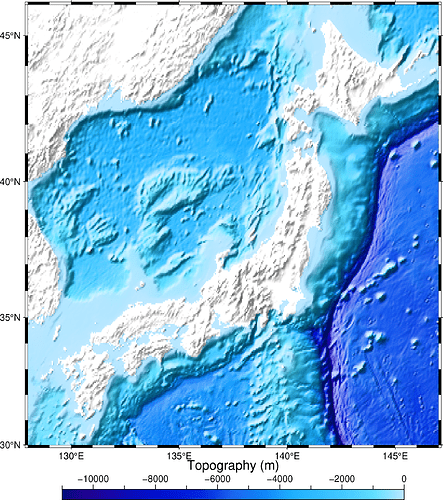
Would you like to do something like this?
gmt begin japan_map_etopo1 png
      gmt basemap -R128/147/30/46 -JM6i -Baf
      gmt makecpt -Cetopo1 -G-11000/0 -
      gmt grdimage @earth_relief -I
      gmt colorbar -DjCB+w5i/0.15i+h+o0/-0.8i -Bx+l"Topography (m)" --MAP_FRAME_PEN=0.5p
gmt end
Thank you! This is exactly the effect I was looking for. 
Great. I edit the script. There was no need for -Q. Also if you don’t set the resolución, then GMT selects ir automatically.


 After all, that is the original CPT from NOAA.

