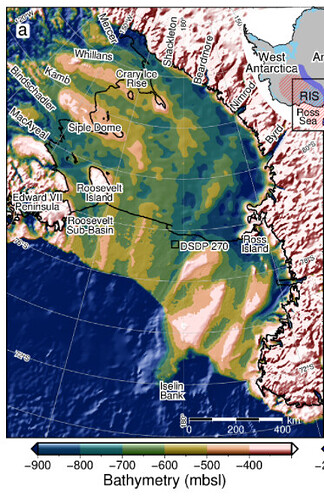
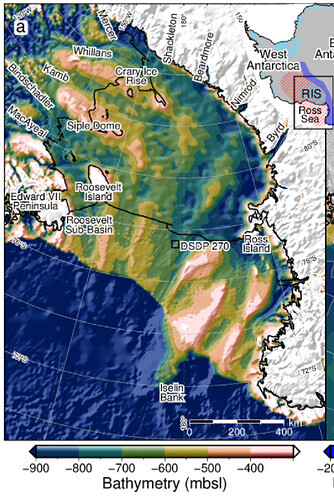
Shading altering color of plot?

I am trying to apply shading to a topography grid, which has the foreground color set to white (topography > -300m). The upper right portion of the first plot shows that this is working correctly. When I apply shading within grdimage, either with default (shading=“+d”) or a grdimage call (shading=“grdgradient+a45+ne.5”) the shaded parts of the figure which should be white became a reddish color. Is there some parameter I’m missing that only changes the brightness of the color, and not the color itself? Thanks!

Below is my code for create the cmap and for plot the grid.

with pygmt.config(COLOR_FOREGROUND='white'):
    pygmt.grd2cpt(grid = '../data/results/Bedmachine_bed_5k_wgs.nc', cmap = 'batlowW',
                limit = '-900/-300', nlevels=7,
                output = '../data/plotting/RE_bathymetry.cpt')

    fig.grdimage(projection=fig_proj,
                 region=fig_reg,
                 grid='../data/results/Bedmachine_bed_5k_wgs.nc',
                 cmap='../data/plotting/RE_bathymetry.cpt',
                 shading="+d", #"grdgradient+a45+ne.5",
                 dpi=500,
                 frame = ["nwse", "xf100000", "yf100000", "g0"])

As far as I can understand, there is quite a lot of topographic features above -300 meters so shaded relief is created there using your palette colors. This results in white highlights and reddish shades, while grdmage without shading just plots everything above -300 m as white.

You probably need to mask everything above -300 m to keep the shaded relief below -300 m and make everything plain white above. E.g. by clipping shaded relief to the -300 m contour from the grid. Or by plotting grdimage without shading above -300 as white and below as 100% transparent on top of the shaded relief.

Also, I think batlow has a default foreground color, based on the CPT file:

F 250/204/250

so that is probably used for any value above your range.

Ok thanks for those answers. If I want to keep the area above -300m shaded, but have the shading be gray instead of pink, is there a way to do that? I thought changing the CPT foreground color to white would have fixed that?

Hi Matt, glad to see your paper coming all nicely, hope you’re doing well in Wellington :grinning_face_with_smiling_eyes:

Anyways, extending on @mkononets’s answer, you could try to shade grid cells <-300m using grdclip to turn elevation values >=-300m to NaN. Specifically, something like

grid_clipped = pygmt.grdclip(
    grid="../data/results/Bedmachine_bed_5k_wgs.nc",
    above=[-300, "NaN"],
)
fig.grdimage(
    grid=grid_clipped,
    shading="+d",
    ...
)

Haven’t tested this, and not sure if the NaN string works properly but give that a go first. You might also need to set COLOR_BACKGROUND or some other config to white.

Similarly, if you want to shade areas above -300m with gray, you could make another grdclip that sets values below -300m to NaN, and do another grdimage call but use a gray colormap instead.

Alternatively, you could try to figure out how to combine two colormaps into one CPT file using https://docs.generic-mapping-tools.org/6.3/makecpt.html. Something like:

gmt makecpt -CbatlowW -T-900/-300/100 -N > RE_bathymetry.cpt
gmt makecpt -Cgray -T-300/-100/100 >> RE_bathymetry.cpt

which would produce a CPT file like:

-900	14.25/55.25/94.25	-800	14.25/55.25/94.25	L
-800	31.75/94.75/97.25	-700	31.75/94.75/97.25	L
-700	89.5/122.25/72.75	-600	89.5/122.25/72.75	L
-600	168.5/149.75/53.75	-500	168.5/149.75/53.75	L
-500	231.25/171.25/132.5	-400	231.25/171.25/132.5	L
-400	255/226.75/225.75	-300	255/226.75/225.75	B
-300	gray25	-200	gray25	L
-200	gray75	-100	gray75	B
B	black
F	white
N	128

and then you would just need to use one grdimage call but pass in this RE_bathymetry.cpt instead.

1 Like

Hey @weiji14! Yes just submitting the final proofs for the paper now, but it’s already online :slight_smile:

We’re missing you here in the ARC!

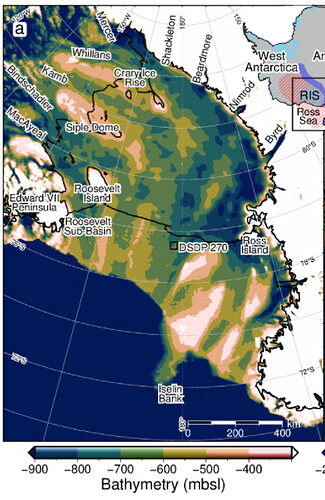
Thanks for the help. The clipping worked perfectly. Here’s the updated figure.

1 Like

Haha cool, glad you got it to work. You must have spent like a year on that figure already! I’m missing Wellington too, especially the wind and ~20°C summers, it’s getting to about 30°C already in Columbus and probably gonna get higher in the coming months. If only the houses were a bit more drafty here :laughing:

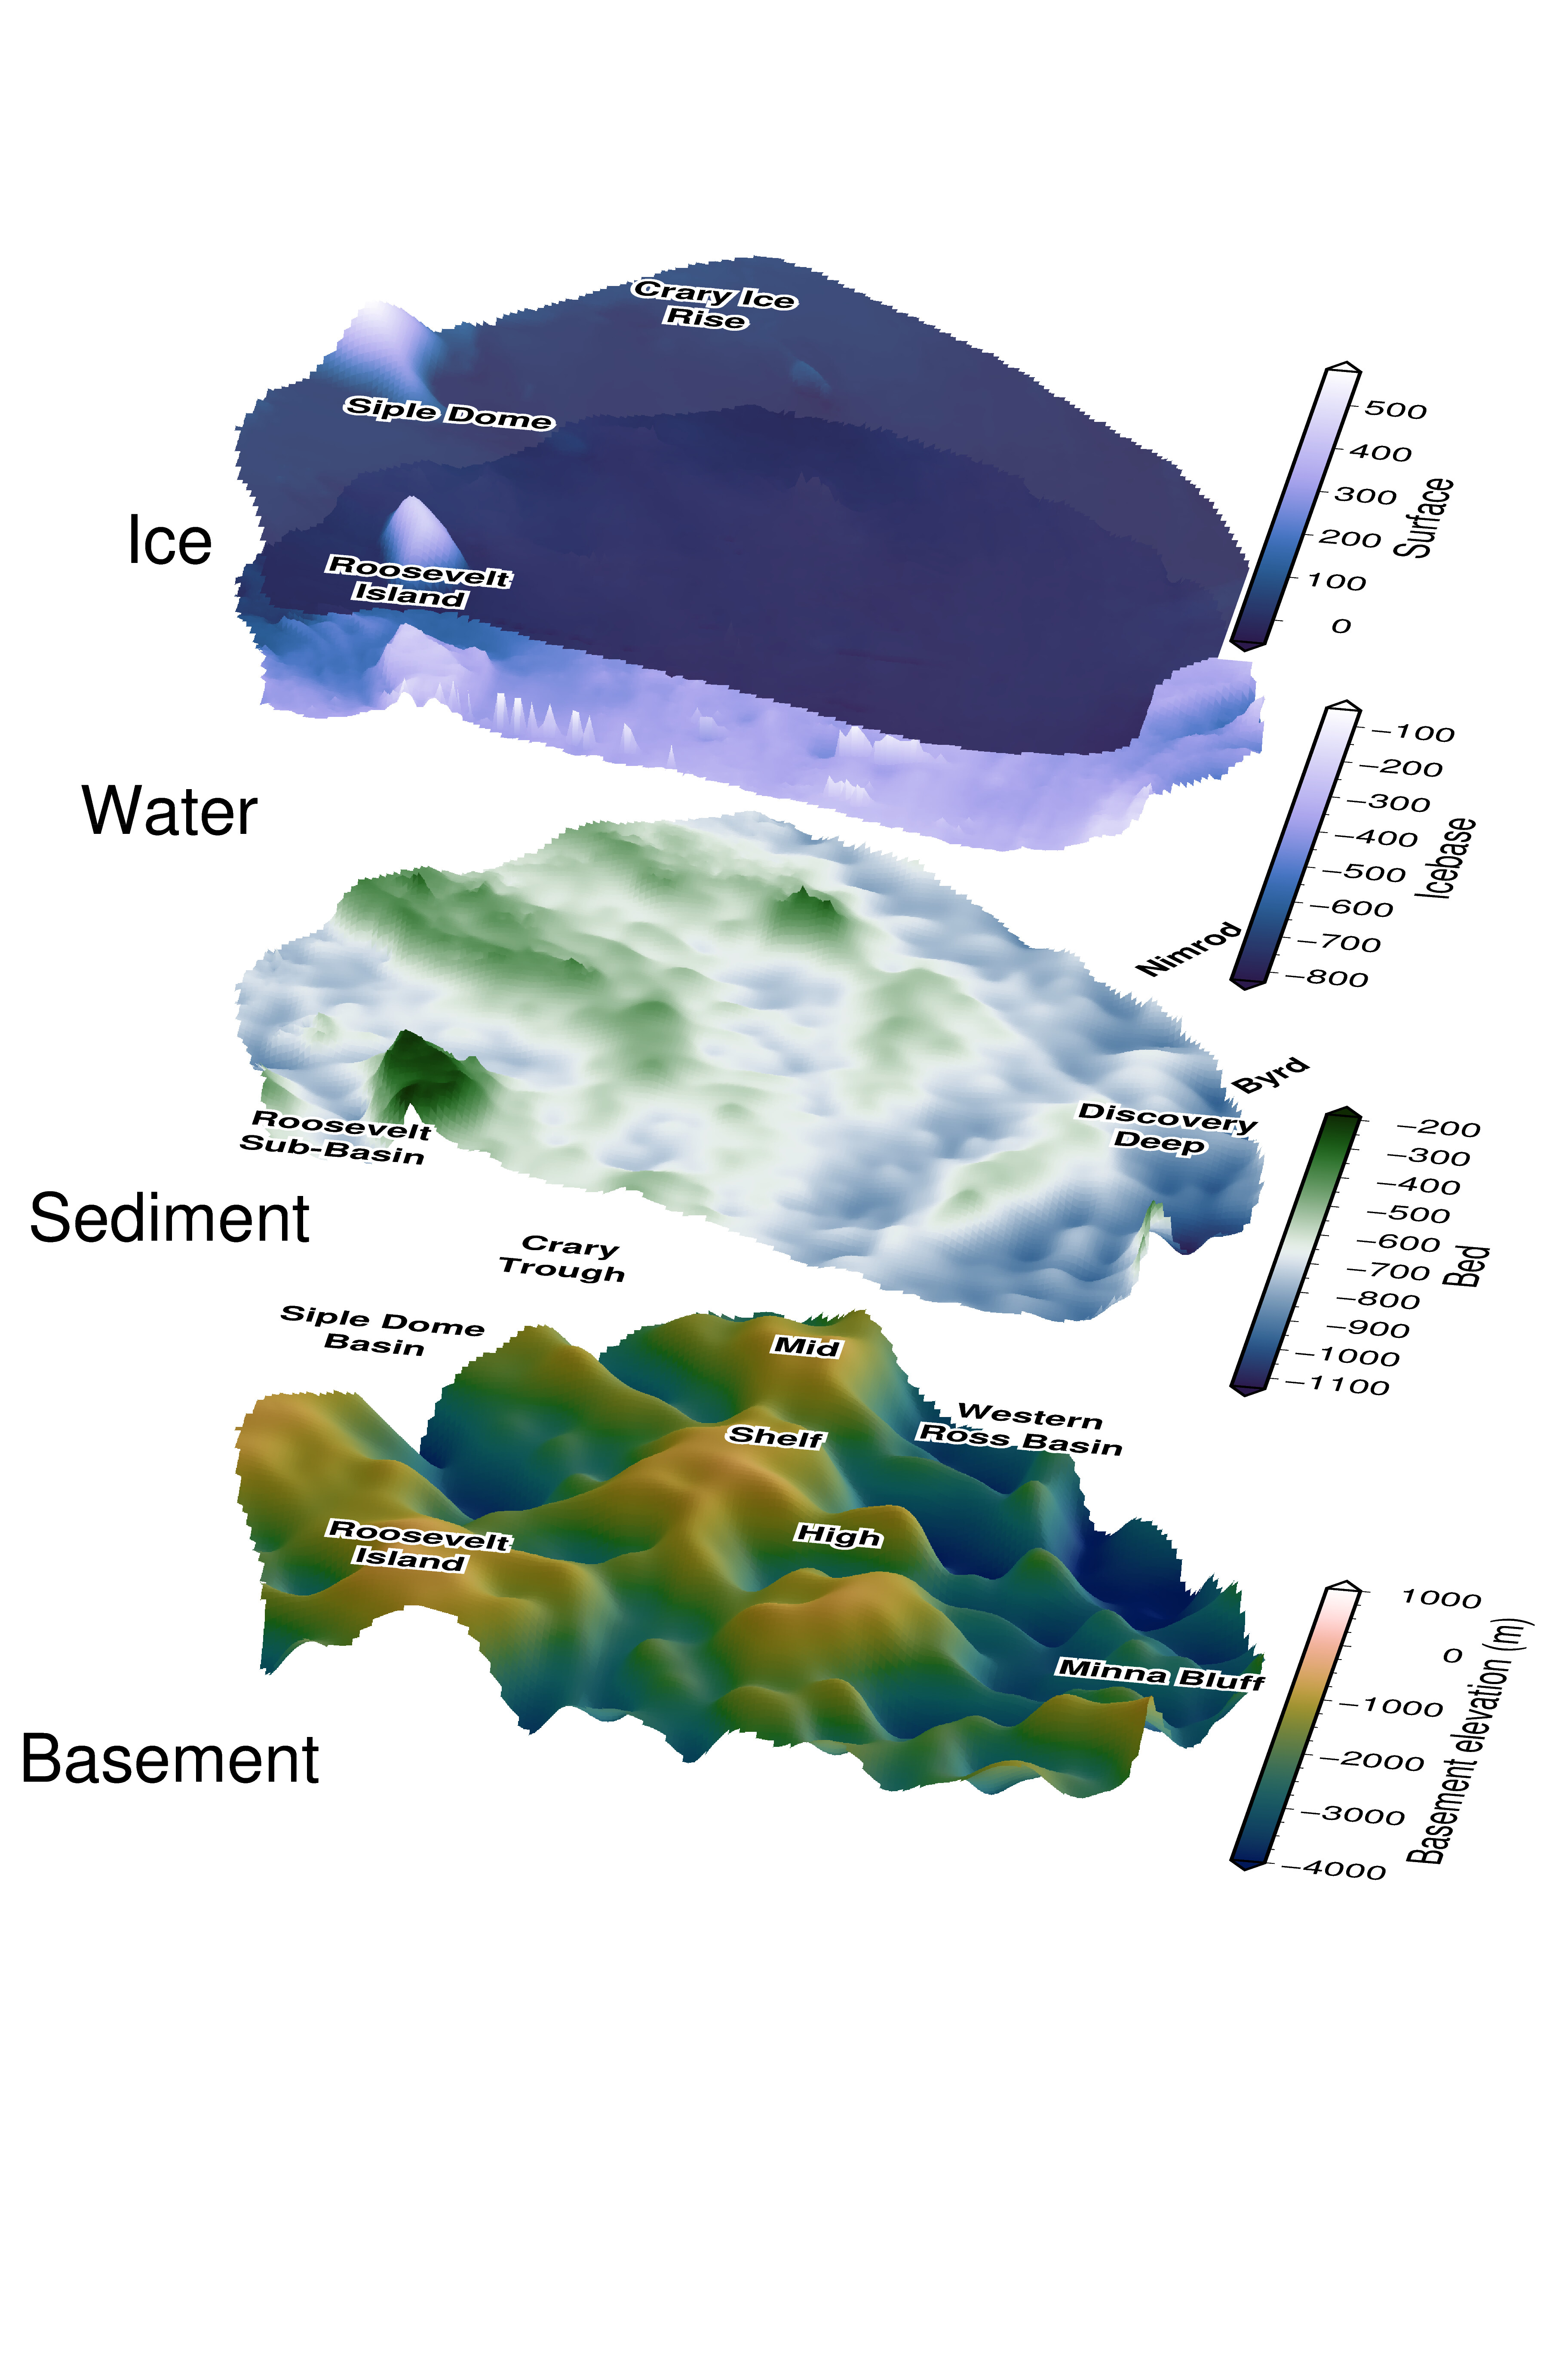
By the way, Matt’s paper is out at https://doi.org/10.1029/2021GL097371 (open access). Plus all the code is at GitHub - mdtanker/RIS_basement_sediment: Ross Ice Shelf basement depths and sediment thickness.

You should definitely showcase this on External Resources — PyGMT @mdtanker :wink:

1 Like

Cool figures, congrats … and a challenge.
Create a color variable line along the the edges of the figure, with the same color as the pixel edges themselves to do an anti-aliasing effect and hide that less pleasing saw-tooth effect that we see.

@weiji14 Thanks for posting that here :slightly_smiling_face: Lots of help from you along the way! Good idea about adding it to the examples.

Good suggestion @Joaquim, I’ll see if I can figure that out and fix it.

Oh, my challenge was not directed specifically to you, but to us all.